

A detailed tutorial for circMine v2
circMine v2 is the update database of circMine, which is specifically designed for systematically integrating, standardizing, and investigating human disease related circRNA transcriptome. Up-to-date, circMine v2 provides 5,899,296 entries between 141,928 circRNAs and 287 circRNA transcriptome datasets with 173 diseases and 5,199 samples across 29 human body sites. The database provides comprehensive analyses to investigate on these data sets and the researchers' own data set for discovering and identifying the biological and clinical significance of circRNA in human diseases.
1. Overview
circMine v2 is a comprehensive and user-friendly web platform designed to enable systematic exploration of circular RNA (circRNA) expression, regulatory networks, and functional mechanisms across diverse biological contexts and human diseases. The platform integrates large-scale circRNA transcriptomic data with multi-layered regulatory and functional annotations, providing a unified resource for both exploratory and hypothesis-driven research.
At the data level, circMine v2 substantially expands its coverage by incorporating 287 circRNA expression datasets spanning 5,199 samples and 173 disease phenotypes. In addition, 46 curated multi-omics datasets are integrated to support transcriptome-wide regulatory analysis. These datasets collectively enable users to investigate circRNA expression patterns, disease associations, and regulatory landscapes at unprecedented scale and resolution.
To facilitate in-depth functional exploration, circMine v2 features a comprehensive circRNA-centered network analysis module, equipped with advanced and interactive visualization tools. The platform further integrates high-confidence annotations, including circRNA-RNA binding protein (RBP) interactions, A-to-I RNA editing events, m6A RNA modifications, and cancer-associated genomic variants involving circRNA regions. These annotations are complemented by automated pipelines for functional interpretation, as well as the OncoCircVar module, which supports personalized clinical analysis of circRNA-associated variants.
circMine v2 also introduces newly developed analytical modules, including weighted gene co-expression network analysis (WGCNA) and feature selection tools, enabling users to identify key circRNA co-expression modules and disease-relevant signatures. Enhanced differential expression and co-expression analysis functionalities provide flexible options for data visualization and result interpretation. Importantly, the platform now supports cross-species circRNA transcriptome analysis, significantly broadening its applicability in comparative and evolutionary studies.
Overall, circMine v2 provides an integrated, scalable, and intuitive web-based environment for dissecting circRNA regulatory networks, uncovering functional mechanisms, and exploring their clinical relevance, thereby serving as a valuable resource for both basic research and translational applications in human disease. The Figure 1 as below presents the overview of data contents and web application features of the database. Table 1 presents the computational resources and the R packages used in the database.
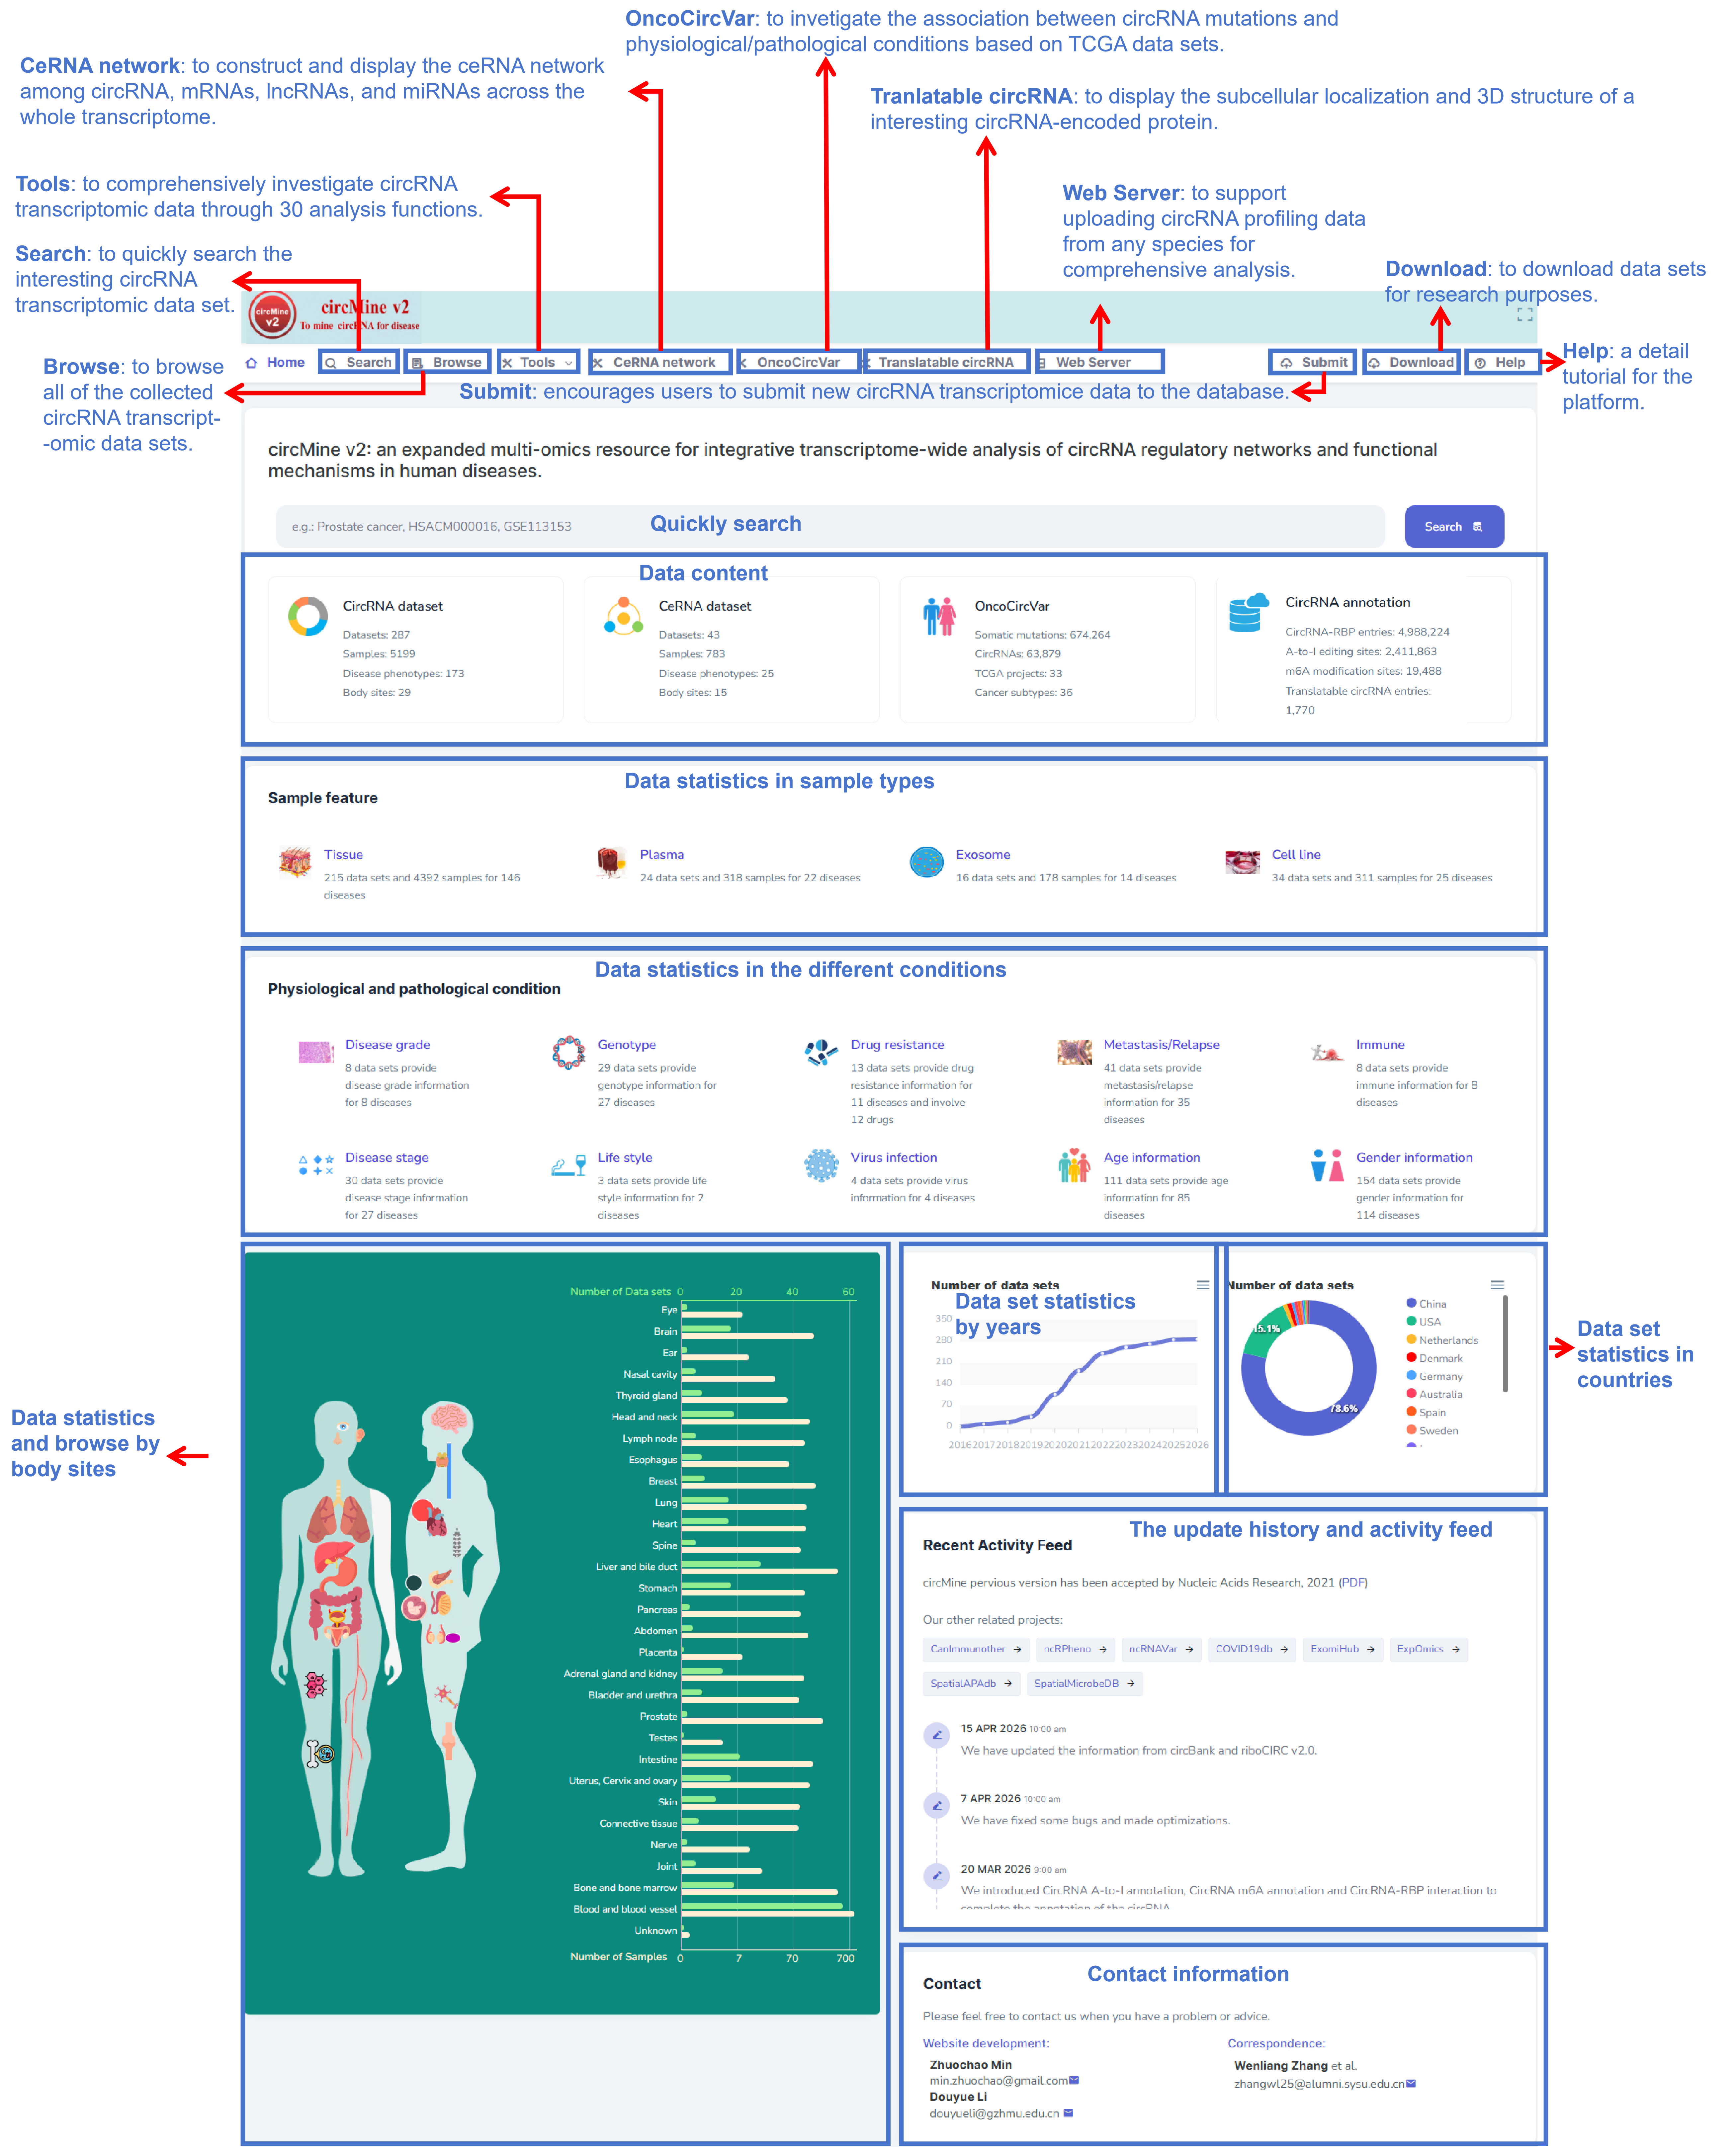
Figure 1. The overview of data contents and web application features of circMine v2.
Table 1. The tools and databases used in circMine v2.
| No | Resource | Description | Version | LInk |
|---|---|---|---|---|
| 1 | bedtools | a powerful toolset for genome arithmetic | v2.25.0 | https://bedtools.readthedocs.io/en/latest/index.html |
| 2 | Bioconductor | Bioconductor uses the R statistical programming language, and is open source and open development. | v3.18 | https://bioconductor.org/ |
| 3 | BLAST | A tool to find regions of similarity between biological sequences. | v 2.11.0+-x64-linux | https://blast.ncbi.nlm.nih.gov/Blast.cgi |
| 4 | circAtlas | A database for circular RNA annotations. | v3.0 | https://ngdc.cncb.ac.cn/circatlas/ |
| 5 | circBank | A database of more than 14,000 human circRNAs with rich annotations. | v 1.0 | http://www.circbank.cn/ |
| 6 | circBase | A database for circRNAs, hosting data from various species, including Homo sapiens, and Mus musculus etc. | v Jul. 2017 | http://circbase.org/ |
| 7 | circlize | An R package for circular RNA Visualization | v0.4.15 | https://cran.r-project.org/web/packages/circlize/index.html |
| 8 | clusterProfiler | An R package for statistical analysis and visualization of functional profiles for genes and gene clusters. | v 3.18.1 | https://github.com/YuLab-SMU/clusterProfiler |
| 9 | colorspace | An R package for manipulating and assessing colors and palettes | v2.1-0 | https://colorspace.r-forge.r-project.org/articles/colorspace.html |
| 10 | corrplot | An R package for visualization of a correlation matrix. | v 0.89 | https://github.com/taiyun/corrplot |
| 11 | data.table | Extension of "data.frame". | v 1.14.0 | https://cran.r-project.org/web/packages/data.table/index.html |
| 12 | DeepLoc | A too for prediction of protein subcellular localization using deep learning. | v 2.0 | https://services.healthtech.dtu.dk/services/DeepLoc-2.0/ |
| 13 | devtools | An R package for making package development in R easier | V2.4.5 | https://github.com/r-lib/devtools |
| 14 | DOSE | An R package for performing disease ontology semantic and enrichment analysis | V3.28.0 | https://github.com/YuLab-SMU/DOSE |
| 15 | dplyr | An R package for for working with data frame like objects, both in memory and out of memory. | v 1.0.7 | https://dplyr.tidyverse.org/ |
| 16 | DrugCentral | A database to provide information on active ingredients chemical entities, pharmaceutical products, drug mode of action, indications, pharmacologic action. | v. 17 May 2020 | https://drugcentral.org/ |
| 17 | easyGgplot2 | An R package for performing and customizing plots easily with ggplot2 | v1.0.0.9000 | https://github.com/kassambara/easyGgplot2 |
| 18 | enrichplot | An R package for visualizing functional enrichment results | v1.22.0 | https://github.com/YuLab-SMU/enrichplot |
| 19 | ENSEMBL | Ensembl is a freely available genomic resource | - | https://asia.ensembl.org/index.html |
| 20 | EnvStats | An R package for environmental statistics, including US EPA Guidance | v2.8.1 | https://cran.r-project.org/web/packages/FactoMineR/index.html |
| 21 | factoextra | An R package for easy multivariate data analyses and elegant visualization. | v 1.07 | https://github.com/cran/factoextra/ |
| 22 | FactoMine | An R package for dedicated to multivariate exploratory data analysis. | v 1.08 | https://cran.r-project.org/web/packages/FactoMineR/index.html |
| 23 | foreign | An R package for read data stored. | v 0.8-81 | https://cran.r-project.org/web/packages/foreign/index.html |
| 24 | GENCODE | A resource for for integrated annotation of gene features. | v. December 2020 | https://www.gencodegenes.org/ |
| 25 | Gene Ontology Database | The Gene Ontology knowledgebase is the world’s largest source of information on the functions of genes | - | https://www.geneontology.org/ |
| 26 | ggplot2 | An R package for elegant graphics for data analysis. | v 3.3.5 | https://cran.r-project.org/web/packages/ggplot2/index.html |
| 27 | ggpubr | An R package for ggplot2 based publication ready plots. | v 0.4.0 | https://cran.r-project.org/web/packages/ggpubr/index.html |
| 28 | ggtree | An R package for ggplot2 to output venn plots. | v3.10.0 | https://github.com/YuLab-SMU/ggtree |
| 29 | ggvenn | An R package for ggplot2 to output venn plots. | v0.1.10 | https://github.com/yanlinlin82/ggvenn |
| 30 | glmnet | An R package for lasso and elastic-Net regularized generalized linear models. | v 4.1-3 | https://cran.r-project.org/web/packages/glmnet/index.html |
| 31 | GPL19978 | Agilent-069978 Arraystar Human CircRNA microarray V1. | v 1.0 | https://www.ncbi.nlm.nih.gov/geo/query/acc.cgi?acc=GPL19978 |
| 32 | GPL21825 | 074301 Arraystar Human CircRNA microarray V2. | v 2.0 | https://www.ncbi.nlm.nih.gov/geo/query/acc.cgi?acc=GPL21825 |
| 33 | gridExtra | An R package for providing miscellaneous functions for "Grid" graphics. | v2.3 | https://cran.r-project.org/web/packages/gridExtra/index.html |
| 34 | igraph | An R package for performing network analysis and visualization. | v1.5.1 | https://github.com/igraph/igraph |
| 35 | IRESbase | A database curated all experimentally validated IRESs in the published literature. | v 1.0 | http://reprod.njmu.edu.cn/cgi-bin/iresbase/index.php |
| 36 | jsonlite | An R package for a practical and consistent mapping between JSON data and R objects. | v 1.7.2 | https://github.com/jeroen/jsonlite |
| 37 | jsonlite | A Simple and Robust JSON Parser and Generator for R | v1.8.8 | https://cran.r-project.org/web/packages/jsonlite/index.html |
| 38 | KEGG PATHWAY Database | A database to provide a collection of manually drawn pathway maps representing our knowledge of the molecular interaction, reaction and relation networks. | v. 3 June 2021 | https://www.genome.jp/kegg/pathway.html |
| 39 | liftOver | A tool to convert genome coordinates and genome annotation files between assemblies. | v 1.0 | https://genome.ucsc.edu/cgi-bin/hgLiftOver |
| 40 | limma | An R package for powers differential expression analyses for RNA-sequencing and microarray studies. | v 2015 | https://bioconductor.org/packages/release/bioc/html/limma.html |
| 41 | maftools | Summarize, Analyze and Visualize MAF Files | v2.14.0 | https://www.bioconductor.org/packages/release/bioc/html/maftools.html |
| 42 | matrix | Sparse and Dense Matrix Classes and Methods | v1.6-4 | https://cran.r-project.org/web/packages/Matrix/index.html |
| 43 | mioncocirc | A compendium of circular RNAs compiled from cancer clinical samples | v0.1 | https://mioncocirc.github.io/ |
| 44 | miRanda | A comprehensive resource of miRNA target predictions and expression profiles. | v Aug. 2010 | http://mirtoolsgallery.tech/mirtoolsgallery/node/1055 |
| 45 | miRBase | A database to provide microRNA sequences from 271 organisms, including hairpin precursors and mature microRNAs. | v 22.1 | https://mirbase.org/ |
| 46 | NCBI GEO | A archive for functional genomics data sets-update. | v Dec. 2021 | https://www.ncbi.nlm.nih.gov/gds |
| 47 | NCBI RefSeq | A comprehensive, integrated, non-redundant, well-annotated set of reference sequences | - | https://www.ncbi.nlm.nih.gov/refseq/ |
| 48 | org.Ag.eg.db | An R package for genome wide annotation for Malaria mosquito (Anopheles gambiae). | v 3.16.0+ | https://bioconductor.org/packages/release/data/annotation/html/org.Ag.eg.db.html |
| 49 | org.At.tair.db | An R package for genome wide annotation for Thale cress (Arabidopsis thaliana). | v 3.16.0+ | https://bioconductor.org/packages/release/data/annotation/html/org.At.tair.db.html |
| 50 | org.Bt.eg.db | An R package for genome wide annotation for Cow (Bos taurus). | v 3.16.0+ | https://bioconductor.org/packages/release/data/annotation/html/org.Bt.eg.db.html |
| 51 | org.Ce.eg.db | An R package for genome wide annotation for Nematode (Caenorhabditis elegans). | v 3.16.0+ | https://bioconductor.org/packages/release/data/annotation/html/org.Ce.eg.db.html |
| 52 | org.Cf.eg.db | An R package for genome wide annotation for Dog (Canis familiaris). | v 3.16.0+ | https://bioconductor.org/packages/release/data/annotation/html/org.Cf.eg.db.html |
| 53 | org.Dm.eg.db | An R package for genome wide annotation for Fruit fly (Drosophila melanogaster). | v 3.16.0+ | https://bioconductor.org/packages/release/data/annotation/html/org.Dm.eg.db.html |
| 54 | org.Dr.eg.db | An R package for genome wide annotation for Zebrafish (Danio rerio). | v 3.16.0+ | https://bioconductor.org/packages/release/data/annotation/html/org.Dr.eg.db.html |
| 55 | org.Gg.eg.db | An R package for genome wide annotation for Chicken (Gallus gallus). | v 3.16.0+ | https://bioconductor.org/packages/release/data/annotation/html/org.Gg.eg.db.html |
| 56 | org.Hs.eg.db | An R package for genome wide annotation for Human (Homo sapiens). | v 3.16.0+ | https://bioconductor.org/packages/release/data/annotation/html/org.Hs.eg.db.html |
| 57 | org.Mm.eg.db | An R package for genome wide annotation for Mouse (Mus musculus). | v 3.16.0+ | https://bioconductor.org/packages/release/data/annotation/html/org.Mm.eg.db.html |
| 58 | org.Mmu.eg.db | An R package for genome wide annotation for Rhesus monkey (Macaca mulatta). | v 3.16.0+ | https://bioconductor.org/packages/release/data/annotation/html/org.Mmu.eg.db.html |
| 59 | org.Pt.eg.db | An R package for genome wide annotation for Chimpanzee (Pan troglodytes). | v 3.16.0+ | https://bioconductor.org/packages/release/data/annotation/html/org.Pt.tair.db.html |
| 60 | org.Rn.eg.db | An R package for genome wide annotation for Rat (Rattus norvegicus). | v 3.16.0+ | https://bioconductor.org/packages/release/data/annotation/html/org.Rn.tair.db.html |
| 61 | org.Sc.sgd.db | An R package for genome wide annotation for Budding yeast (Saccharomyces cerevisiae). | v 3.16.0+ | https://bioconductor.org/packages/release/data/annotation/html/org.Sc.tair.db.html |
| 62 | org.Ss.eg.db | An R package for genome wide annotation for Pig (Sus scrofa). | v 3.16.0+ | https://bioconductor.org/packages/release/data/annotation/html/org.Ss.tair.db.html |
| 63 | org.Xl.eg.db | An R package for genome wide annotation for Afican clawed frog (Xenopus laevis). | v 3.16.0+ | https://bioconductor.org/packages/release/data/annotation/html/org.Xl.tair.db.html |
| 64 | pathview | An R package for pathway-based data integration and visualization. | v 1.30.1 | https://github.com/datapplab/pathview |
| 65 | pheatmap | An R package for pretty heatmaps. | v 1.0.12 | https://cran.r-project.org/web/packages/pheatmap/index.html |
| 66 | plotROC | An R package for generate useful ROC curve charts for print and interactive use. | v 2.2.1 | https://cran.r-project.org/web/packages/plotROC/index.html |
| 67 | R | A free software environment for statistical computing and graphics. | v 4.2.0 | https://www.r-project.org/ |
| 68 | R Project | A free software environment for statistical computing and graphics. | v 4.0.3 | https://www.r-project.org/ |
| 69 | randomcoloR | An R package for generating attractive random colors. | v1.1.0.1 | https://github.com/ronammar/randomcoloR |
| 70 | RColorBrewer | An R package for colorBrewer palettes | v1.1-3 | https://cran.r-project.org/web/packages/RColorBrewer/ |
| 71 | reshape2 | An R package for reshaping data. | v 1.4.4 | https://cran.r-project.org/web/packages/reshape2/index.html |
| 72 | Rgraphviz | An R package for plotting capabilities for R graph objects. | v 2.34.0 | https://bioconductor.org/packages/release/bioc/html/Rgraphviz.html |
| 73 | riboCIRC | A comprehensive database of translatable circRNAs. | v 1.0 2021 | http://ribocirc.com/index.html |
| 74 | ROCR | An R package for visualizing the performance of scoring classifiers. | v 1.0-11 | https://cran.r-project.org/web/packages/ROCR/index.html |
| 75 | scatterplot3d | An R package for 3D Scatter Plot. | v 0.3-41 | https://cran.r-project.org/web/packages/scatterplot3d/index.html |
| 76 | stringi | An R package for common string operations. | v1.7.12 | https://github.com/gagolews/stringi |
| 77 | stringr | An R package for common string operations. | v 1.4.0 | https://stringr.tidyverse.org/ |
| 78 | survival | An R package for survival analysis. | v 3.2-11 | https://github.com/therneau/survival |
| 79 | survminer | An R package for drawing survival curves using ggplot2. | v 0.4.9 | https://github.com/kassambara/survminer |
| 80 | TCGA | The Cancer Genome Atlas a landmark cancer genomics program | - | https://www.cancer.gov/ccg/research/genome-sequencing/tcga |
| 81 | TCGAbiolinks | An R/Bioconductor package for integrative analysis with GDC data | v2.25.3 | https://bioconductor.org/packages/release/bioc/html/TCGAbiolinks.html |
| 82 | tidytree | An R package for phylogenetic tree data manipulation. | v0.4.5 | https://github.com/YuLab-SMU/tidytree |
| 83 | tidyverse | R packages for data science. | v 1.3.1 | https://github.com/tidyverse/tidyverse |
| 84 | topGO | An R package for enrichment analysis for Gene Ontology. | v 2.42.0 | https://bioconductor.org/packages/release/bioc/html/topGO.html |
| 85 | UNIPROT | the Universal Protein Knowledgebase | - | https://www.uniprot.org/ |
| 86 | usethis | An R package for automating package and project setup | v2.2.2 | https://github.com/r-lib/usethis |
| 87 | WGCNA | An R package for weighted correlation network analysis. | v 1.70-3 | https://github.com/cran/WGCNA |
| 88 | yulab.utils | R packages for managing and supporting functions in packages maintained by 'YuLab-SMU' | v0.1.0 | https://github.com/YuLab-SMU/yulab.utils |
| 89 | sva | R package for removing batch effects and other unwanted variation in high-throughput experiment, v3.50.0 | v3.50.0 | https://www.bioconductor.org/packages/release/bioc/html/sva.html |
2. Search
The search application allows to enter multiple circBase IDs and a keyword (such as a disease, drug, virus infection, circMine ID, and GEO ID) with various filtering parameters (Figure 2A) to efficiently retrieve an interesting circRNA transcriptomic data sets in the database for further investigation. The retrieving results are presented in a table. The filter box allows to quick search. A menu at the header of table can be used to set columns and rows to show the interesting information. In addition, right click on the table body displays an instruction form to copy and export the table (Figure 2B). The circMine ID in Figure 2B links to further web page for the detail information of the data set, and navigates to the differential expression and the co-expression modules (Figure 3).
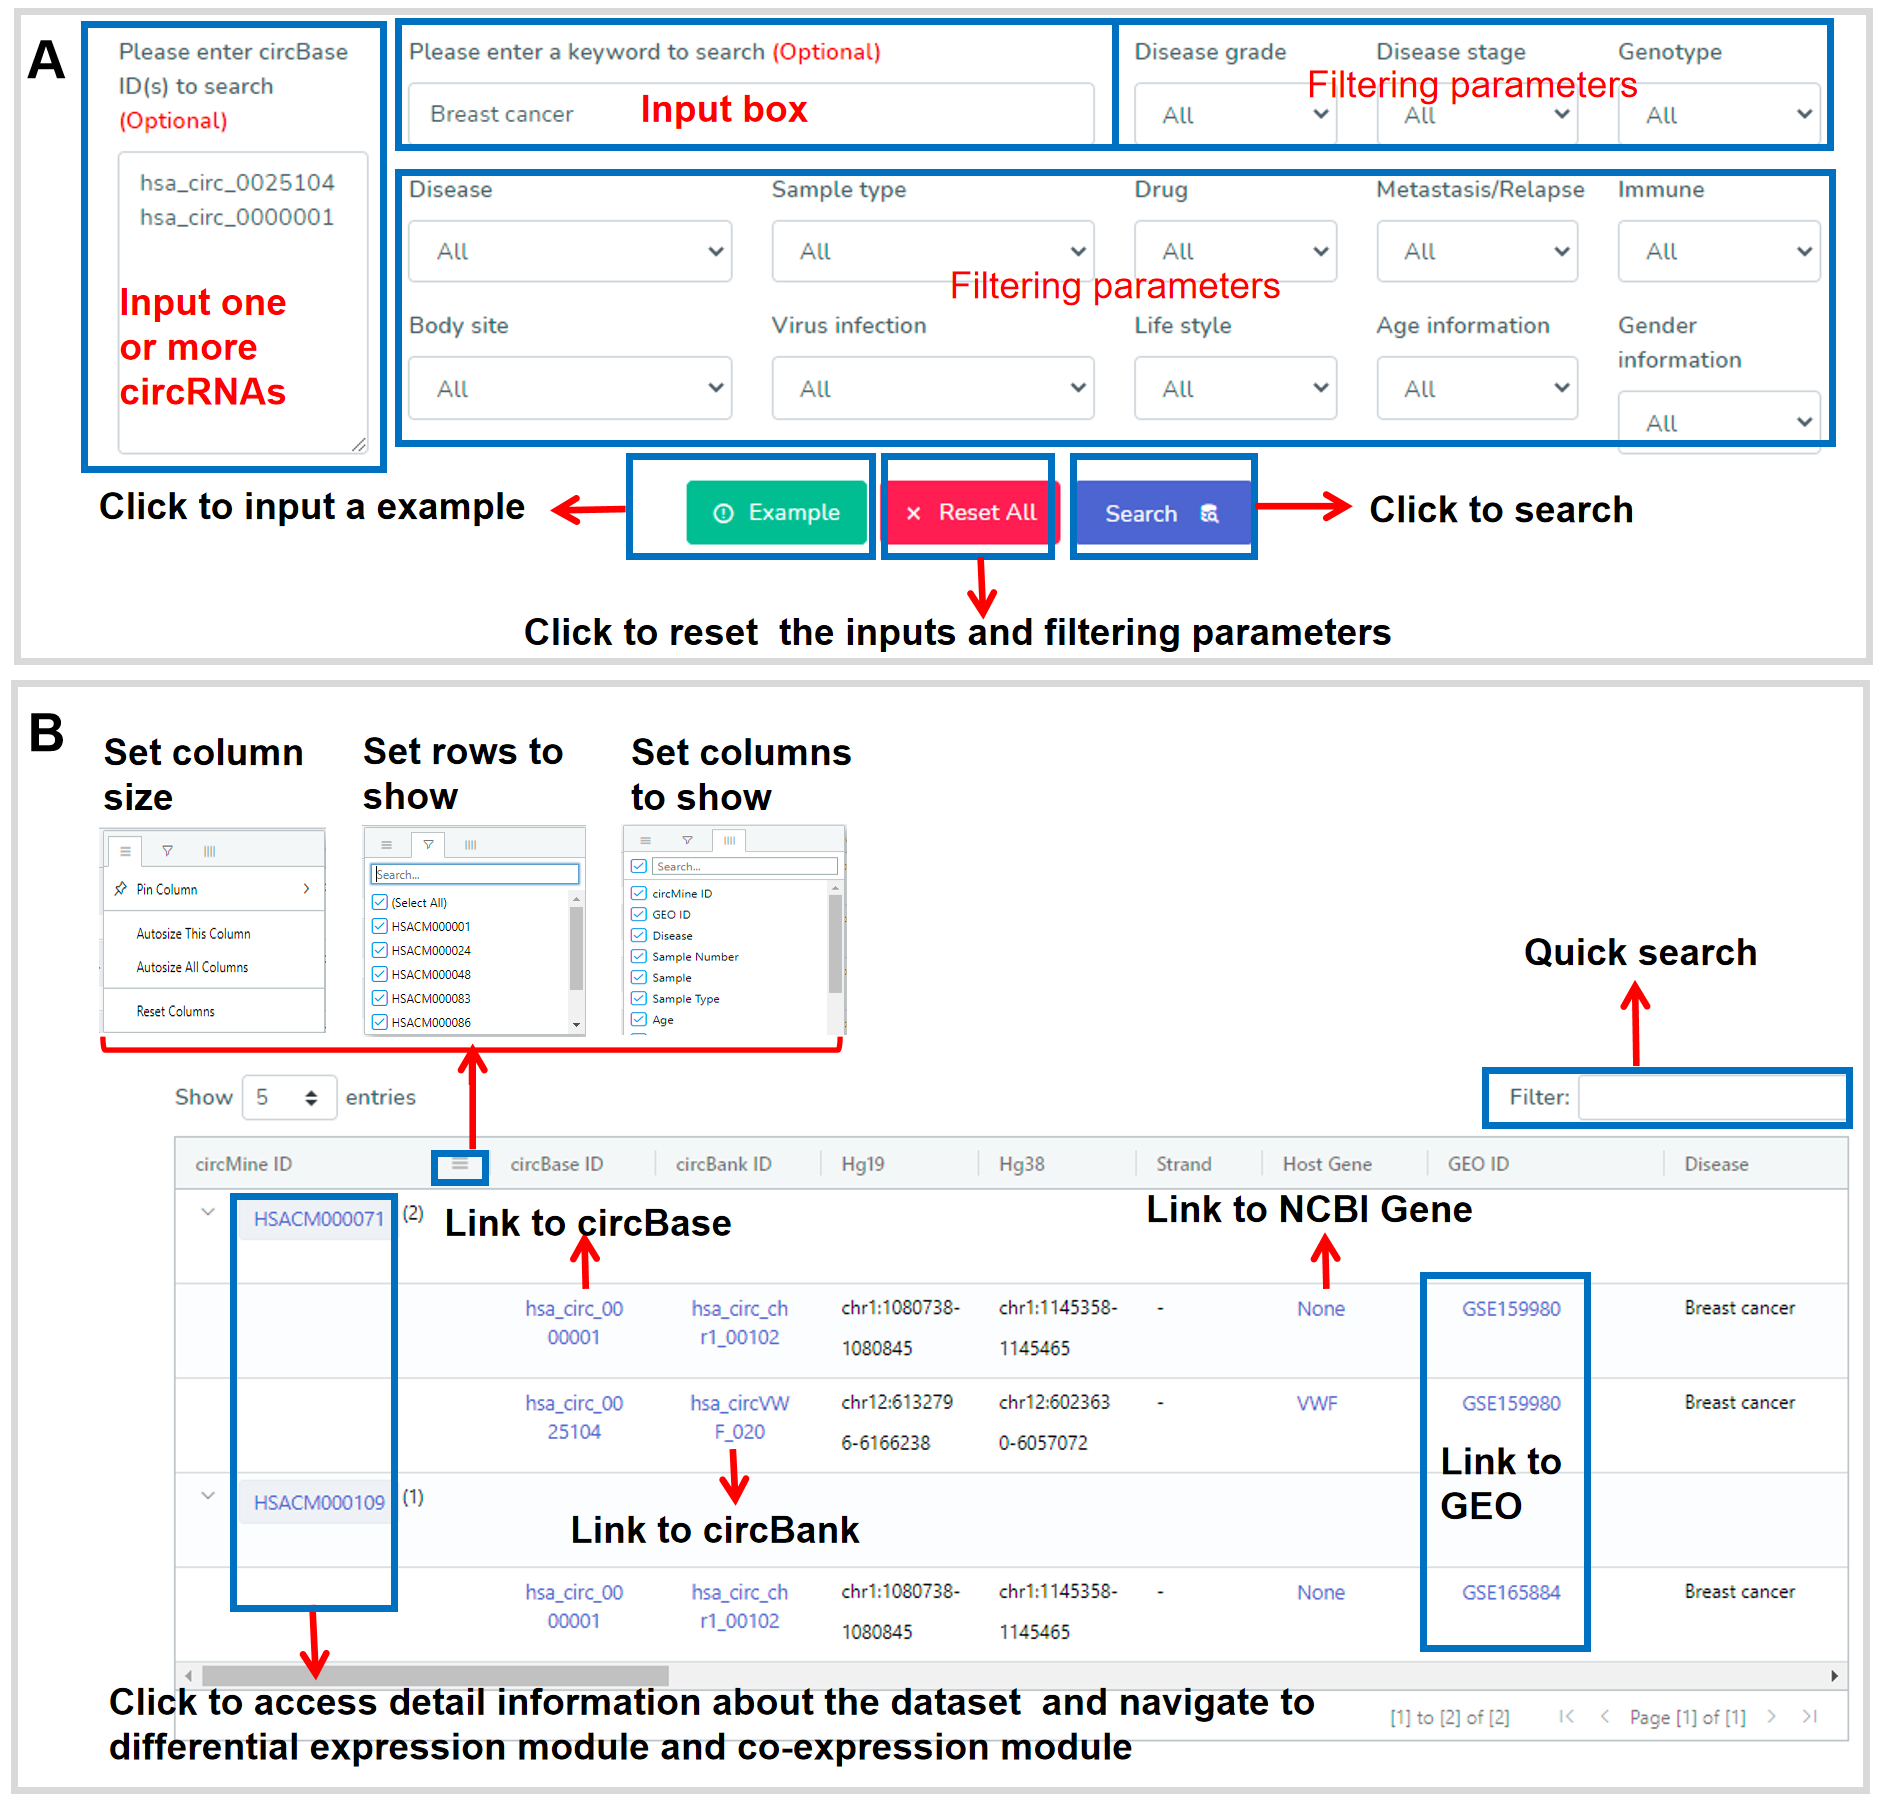
Figure 2. The web interface of the search application.
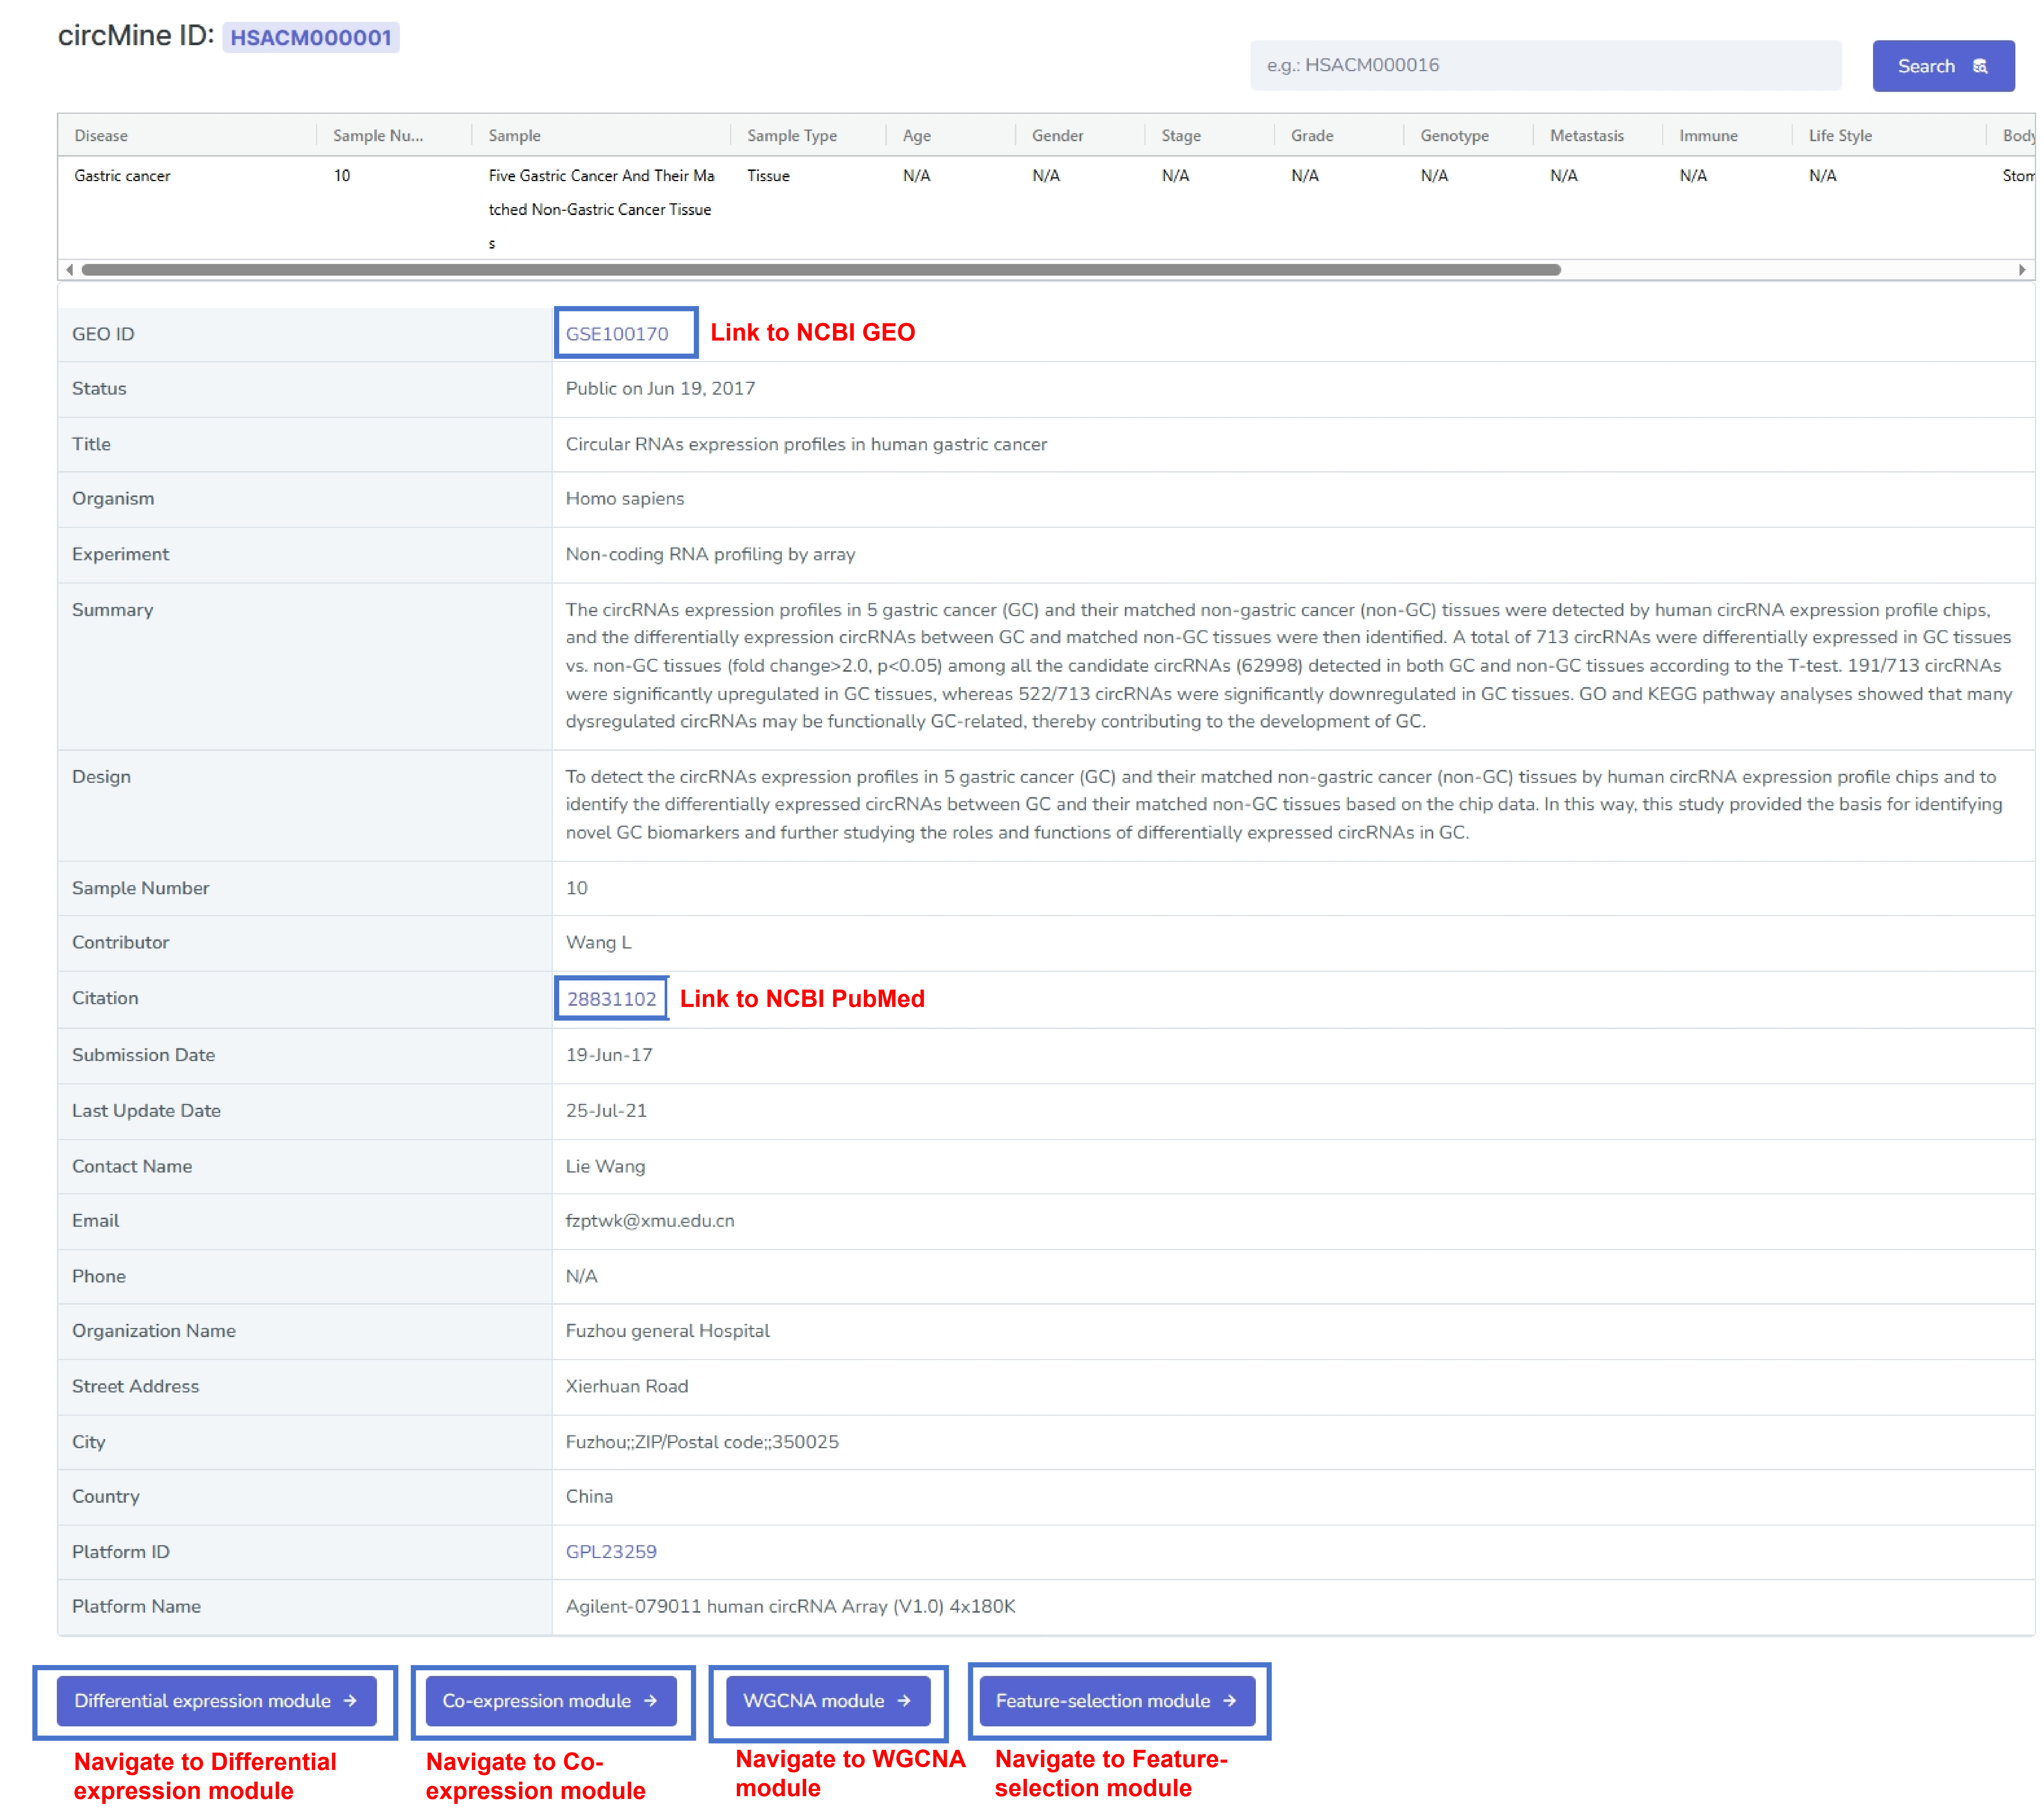
Figure 3. The detail information for circRNA transcriptomic data set.
3. Browse
The browse application allows to display all of the information of the circRNA transcriptomic data sets in a table (Figure 4). Users can click the "Browse circRNAs" button to browse circRNA details in the data set. A menu at the table header can be used to set columns and rows to show the interesting information for the data sets. The filter box allows to quick search (Figure 4). The circMine ID in Figure 4 links to further web page for the detail information about the data set and navigates to the differential expression and co-expression modules (Figure 3). In addition, right clicking on the table body displays an instruction form to copy and export the table (Figure 4).
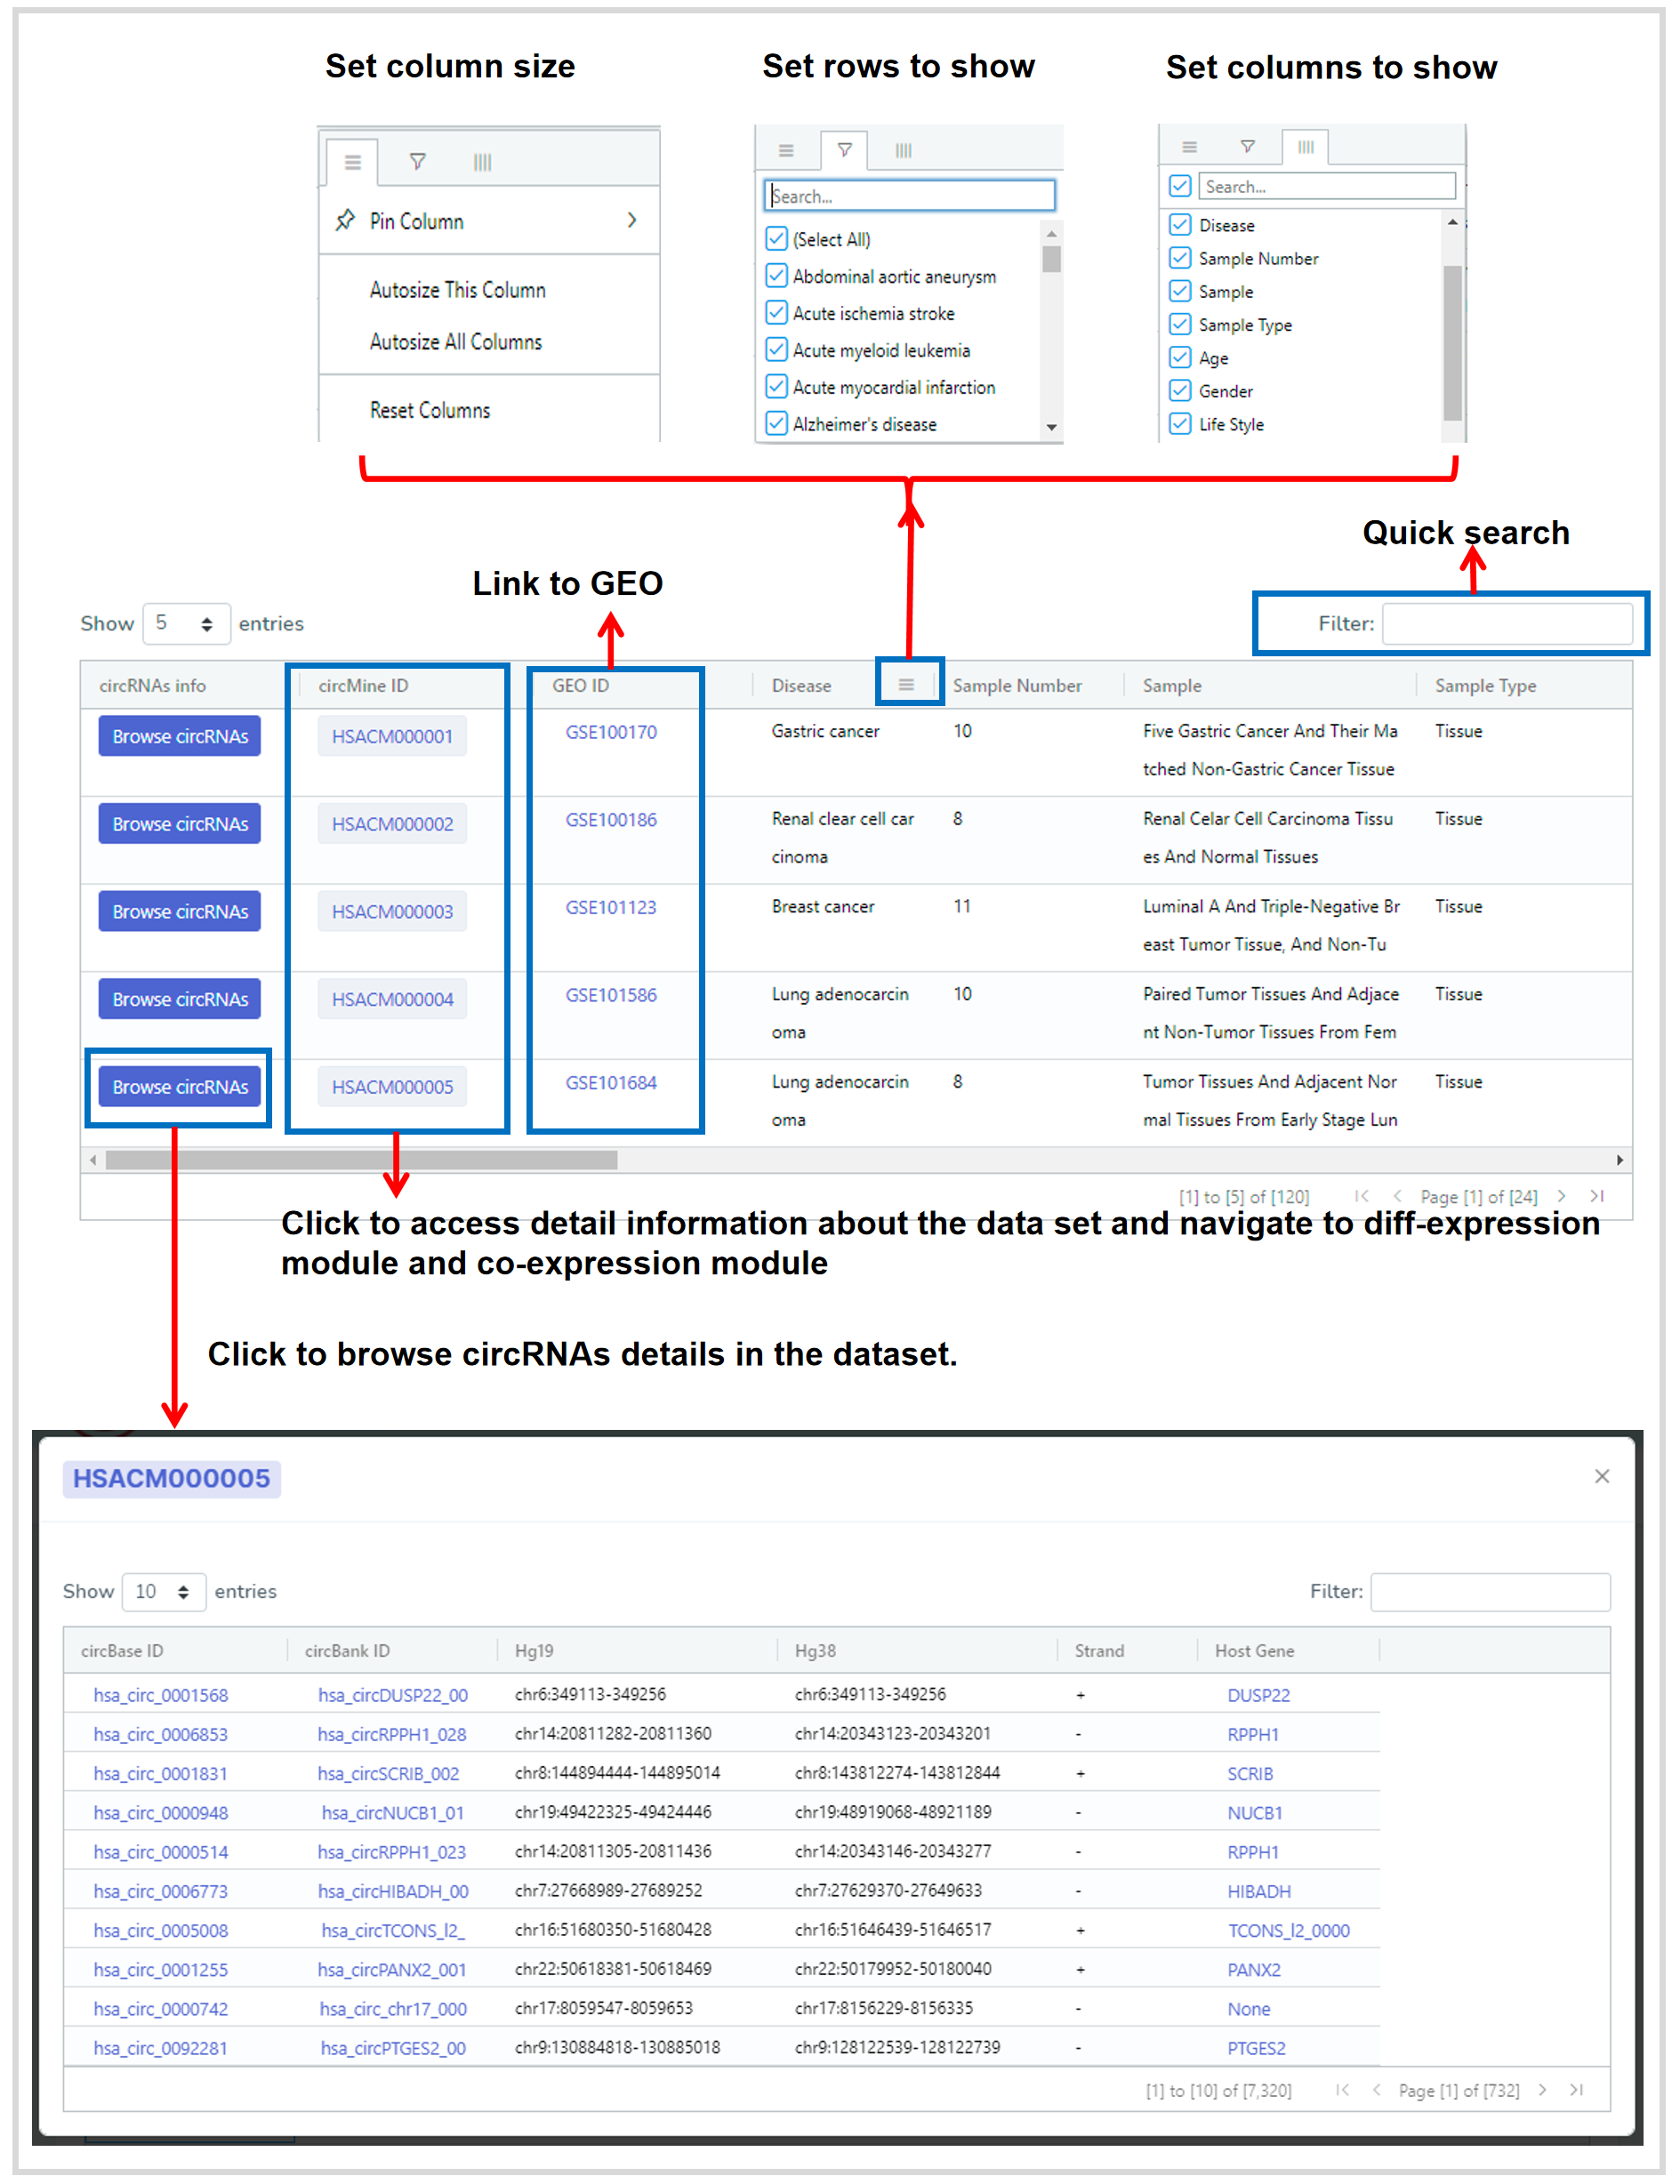
Figure 4. The web interface of the browse application.
4. Differential expression module
Currently, the differential expression module provides seven differential expression
analyses to comprehensively investigate the circRNA transcriptomic data through custom
grouping based on its physiological and pathological conditions (Figure 5). The twelve
analyses include
General analysis,
Differential expression,
ViolinPlot,
BoxplotUnfact,
BoxplotFacet,
VolcanoPlot,
Heatmap,
GO enrichment,
GO GSEA,
KEGG enrichment,
KEGG GSEA,
and
GO TreePlot (Figure 5).
All of the results from these analyses are displayed as a graph or table.
The graph results can be freely downloaded and saved as a PDF file with high
resolution, while the table results provide a filter box that allows to quick search
and a menu at the table header to fit columns and rows to show the interesting
information. In addition, right clicking on the table body will displays an instruction
form to copy and export the table results for further analyses. These analyses were detailed
underneath.
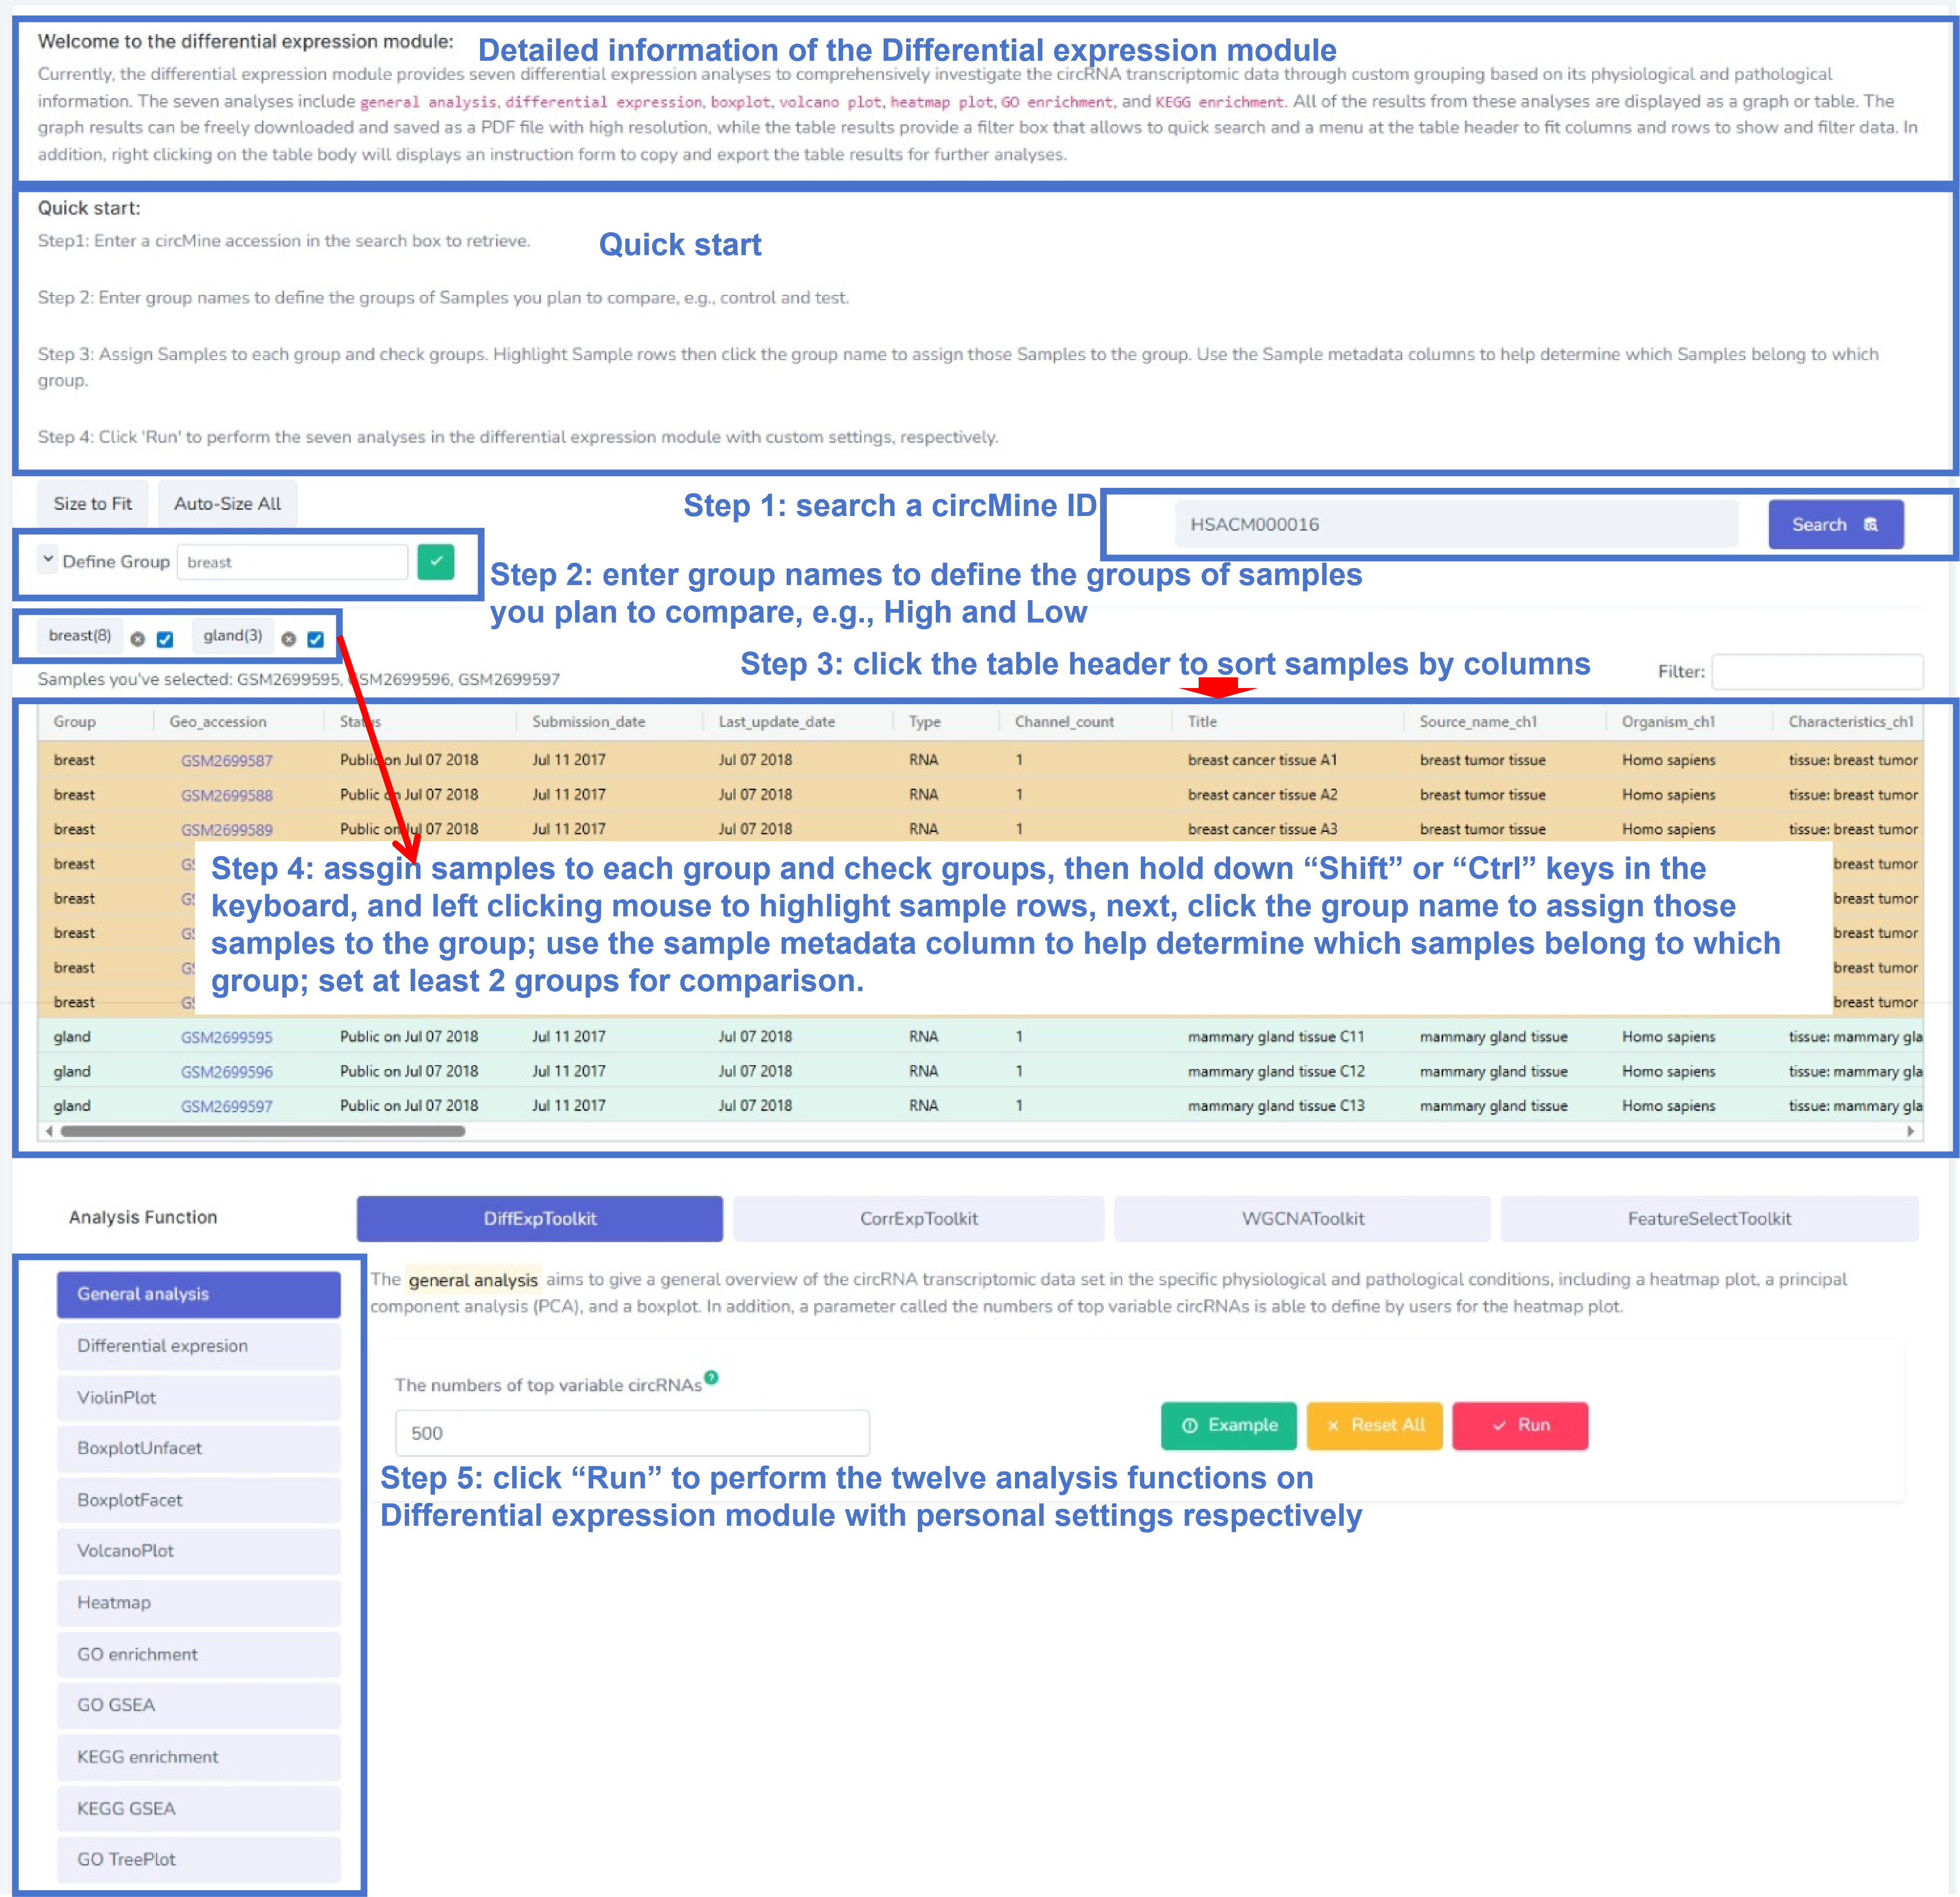
Figure 5. The web interface of the Differential expression module.
Description: The General analysis aims to give a general overview
of the circRNA transcriptomic data set, including heatmap plot, principal component
analysis (PCA), and boxplot. We have detailed the general analysis in Figure 6.
The results can be freely downloaded and saved as a PDF file with high resolution.
R package(s): The dplyr, FactoMine, factoextra, pheatmap, and ggplot2
packages are used for the general analysis,
involving in the data processes, PCA analysis, heatmap plot, and box plot.
Parameter(s): The numbers of top variable circRNAs for the heatmap
plot.
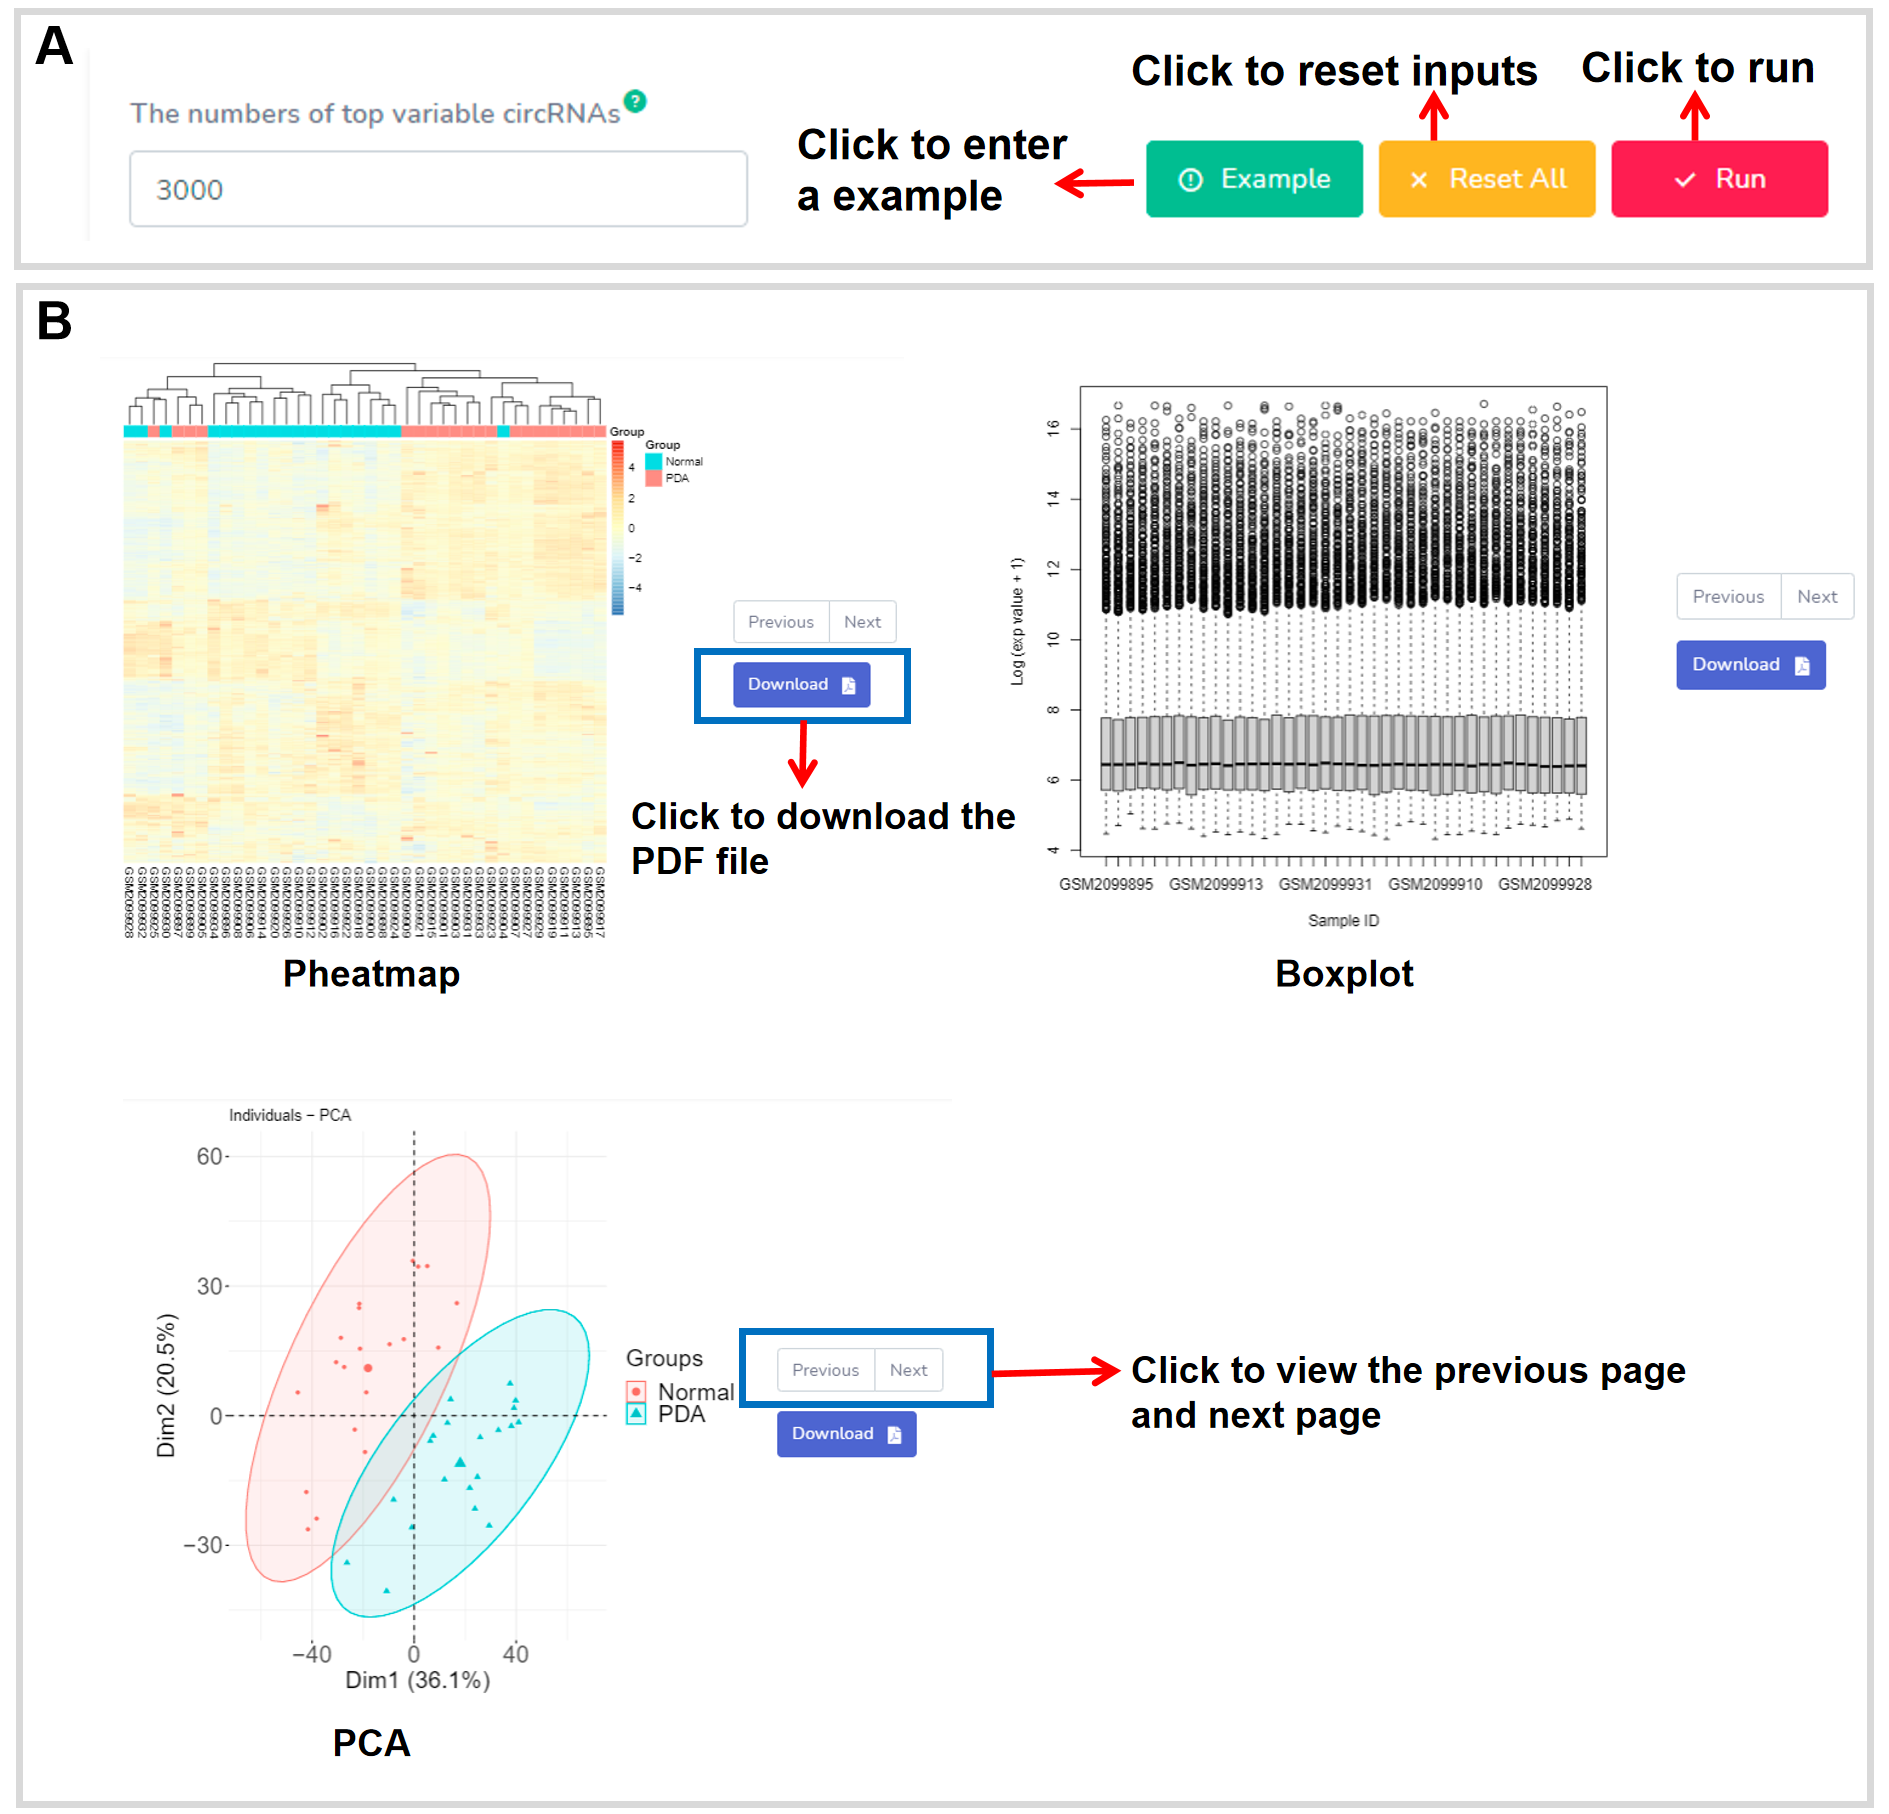
Figure 6. The web interface of General analysis.
Description: The Differential expression analysis is aimed to discover
and identify all of significant circRNAs between different physiological and
pathological conditions by using the method of limma. The differential
analysis results are displayed in a table (Figure 7). The results of differential
expression results can
link to predict the circRNA-miRNA interaction, circRNA IRES, and ribo-circRNA
location.
A menu at the table header can be used to set columns and rows to show interesting
information
(Figure 7). The filter box allows to quick search. In addition, right clicking on
the table
body displays an instruction form to copy and export the table (Figure 7).
Moreover, the circBase ID links to circBase for the detail information of the
circRNA.
R package(s): The limma, dplyr, and jsonlite packages are used for
the
differential expression
analysis, involving in the data processes and differential expression analysis.
Parameter(s):Log2FC cutoff:a threshold value of log2FC (two-folds change) to define the significant differential circRNA;p-value cutoff:a threshold p-value to define the significant differential circRNA;
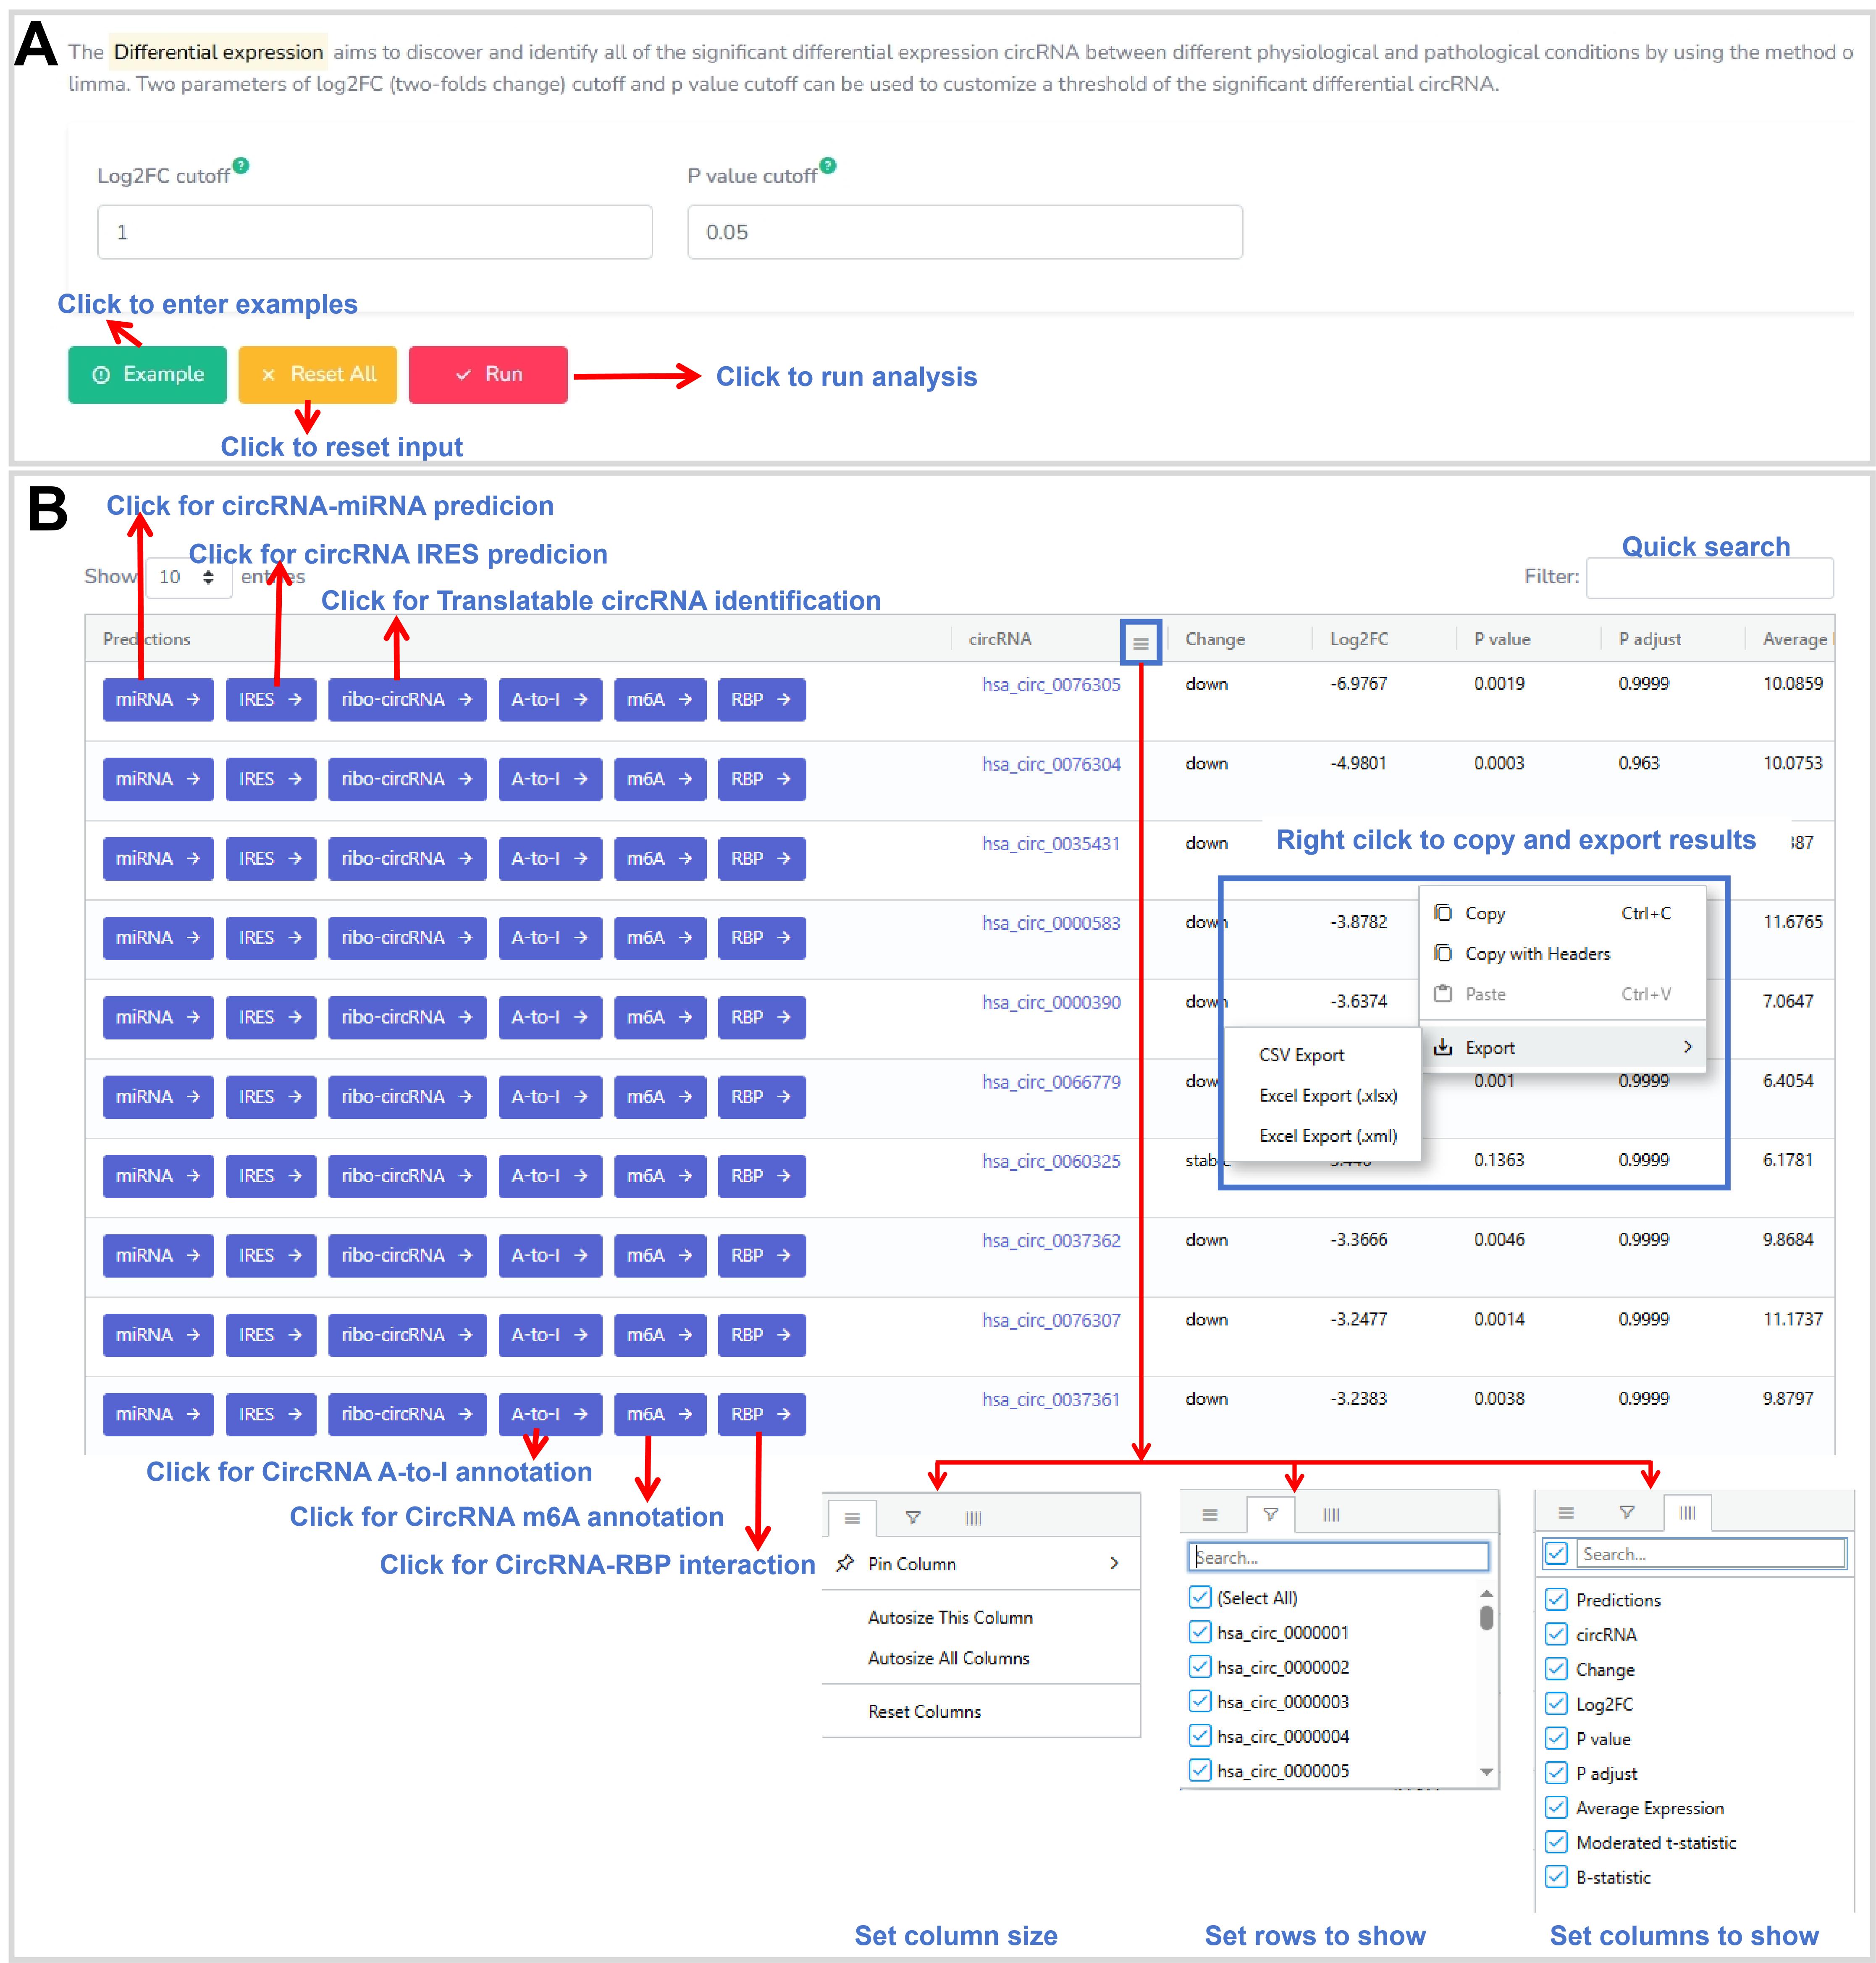
Figure 7. The web interface of the Differential expression analysis.
Description: The ViolinPlot analysis function aims to draw a violin
plot to show the differential expression of one or multiple circRNAs among different
physiological and pathological conditions. The result displays as a violin plot
(Figure 8), which can be freely downloaded and saved as a PDF file with high
resolution.
(na: p> 0.05; *: p<=0.05; **: p<=0.01; ***: p<=0.001; ****: p<=0.0001)
R package(s):The dplyr, EnvStats, reshape2, stringr and ggpubr
packages are used for the ViolinPlot, involving in the data processes, differential
expression analysis, and violin plot.
Parameter(s):circRNA:circBase ID(s);Method:a method for the differential expression analysis, including t.test, wilcox.test, anova, and kruskal.test; P-value format: a format of p-value for displaying.
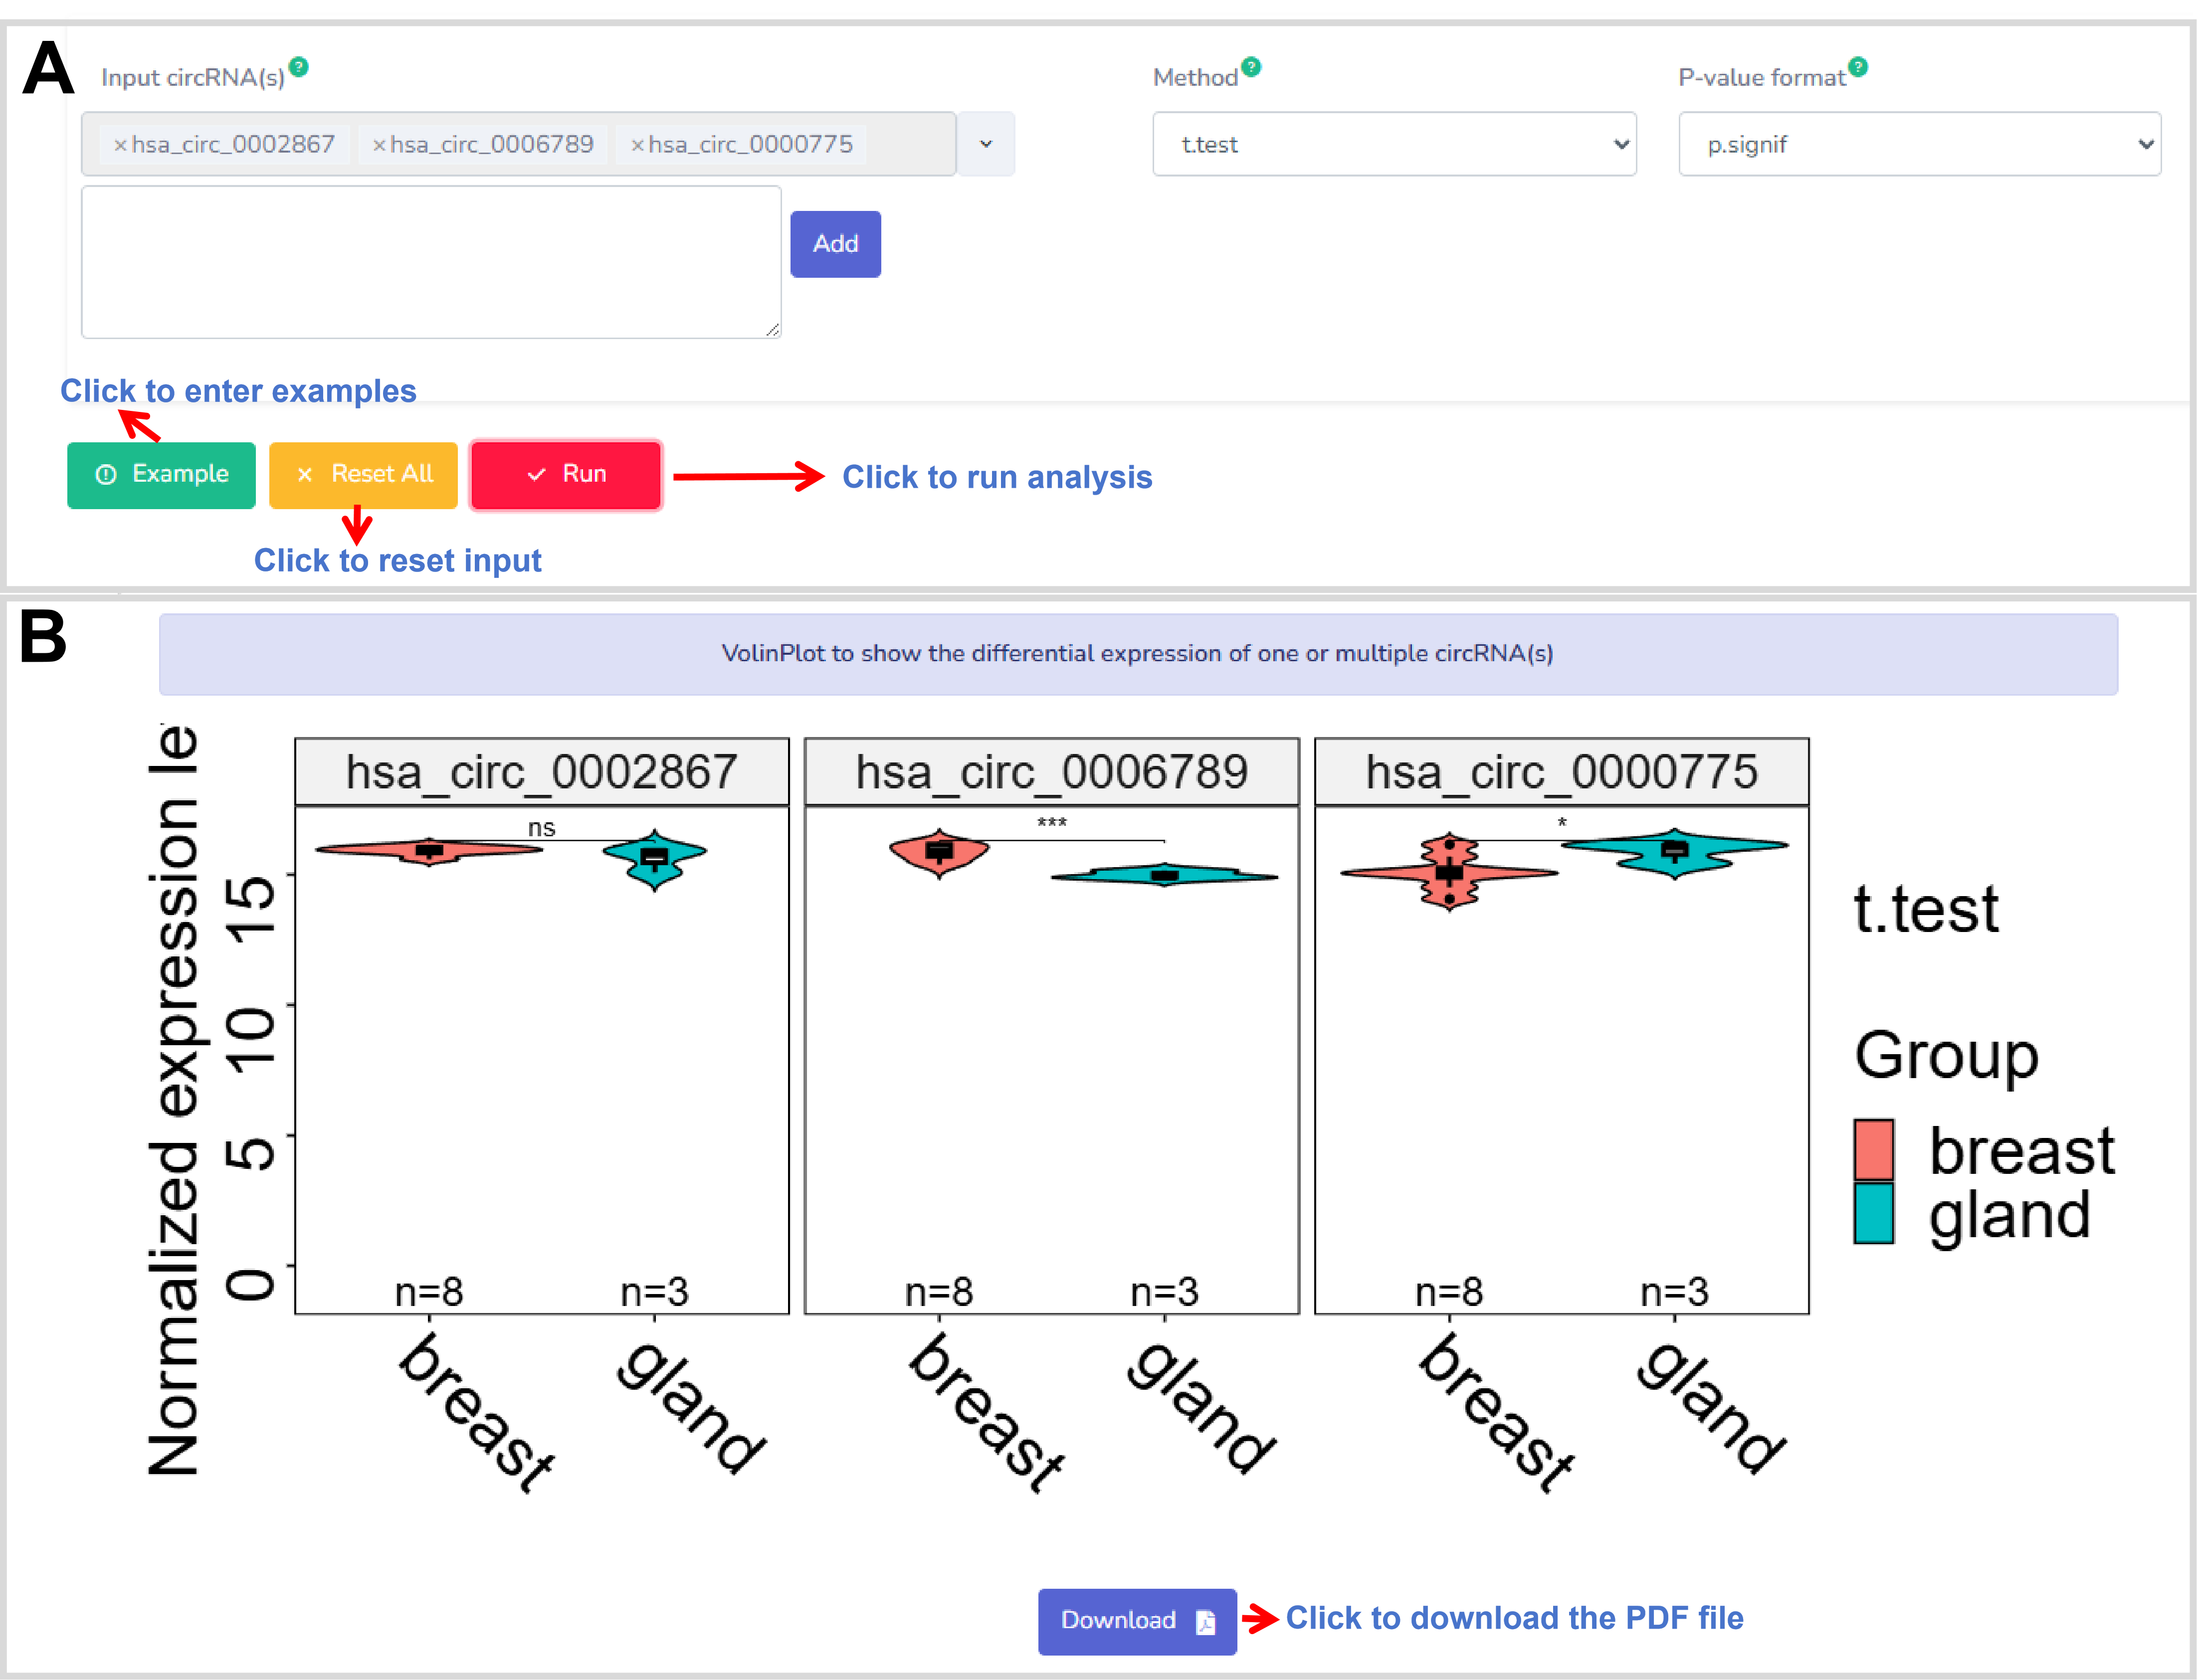
Figure 8. The web interface of the ViolinPlot.
Description: The BoxplotUnfacet analysis function aims to draw a box
plot without facet to show the differential expression of one or multiple circRNAs
among different pathological or physiological conditions. The result displays as a
box plot (Figure 9), which can be freely downloaded and saved as a PDF file with
high resolution. (na: p>0.05; *: p<=0.05; **: p<=0.01; ***: p<=0.001; ****:
p<=0.0001)
R package(s):The dplyr, reshape2, ggplot2, gridExtra and ggpubr
packages are used for the unfacet boxplot, involving in the data processes,
differential expression analysis, and boxplot.
Parameter(s):circRNA:circBase ID(s);Method:a method for the differential expression analysis, including t.test, wilcox.test, anova, and kruskal.test; P-value format: a format of p-value for displaying.
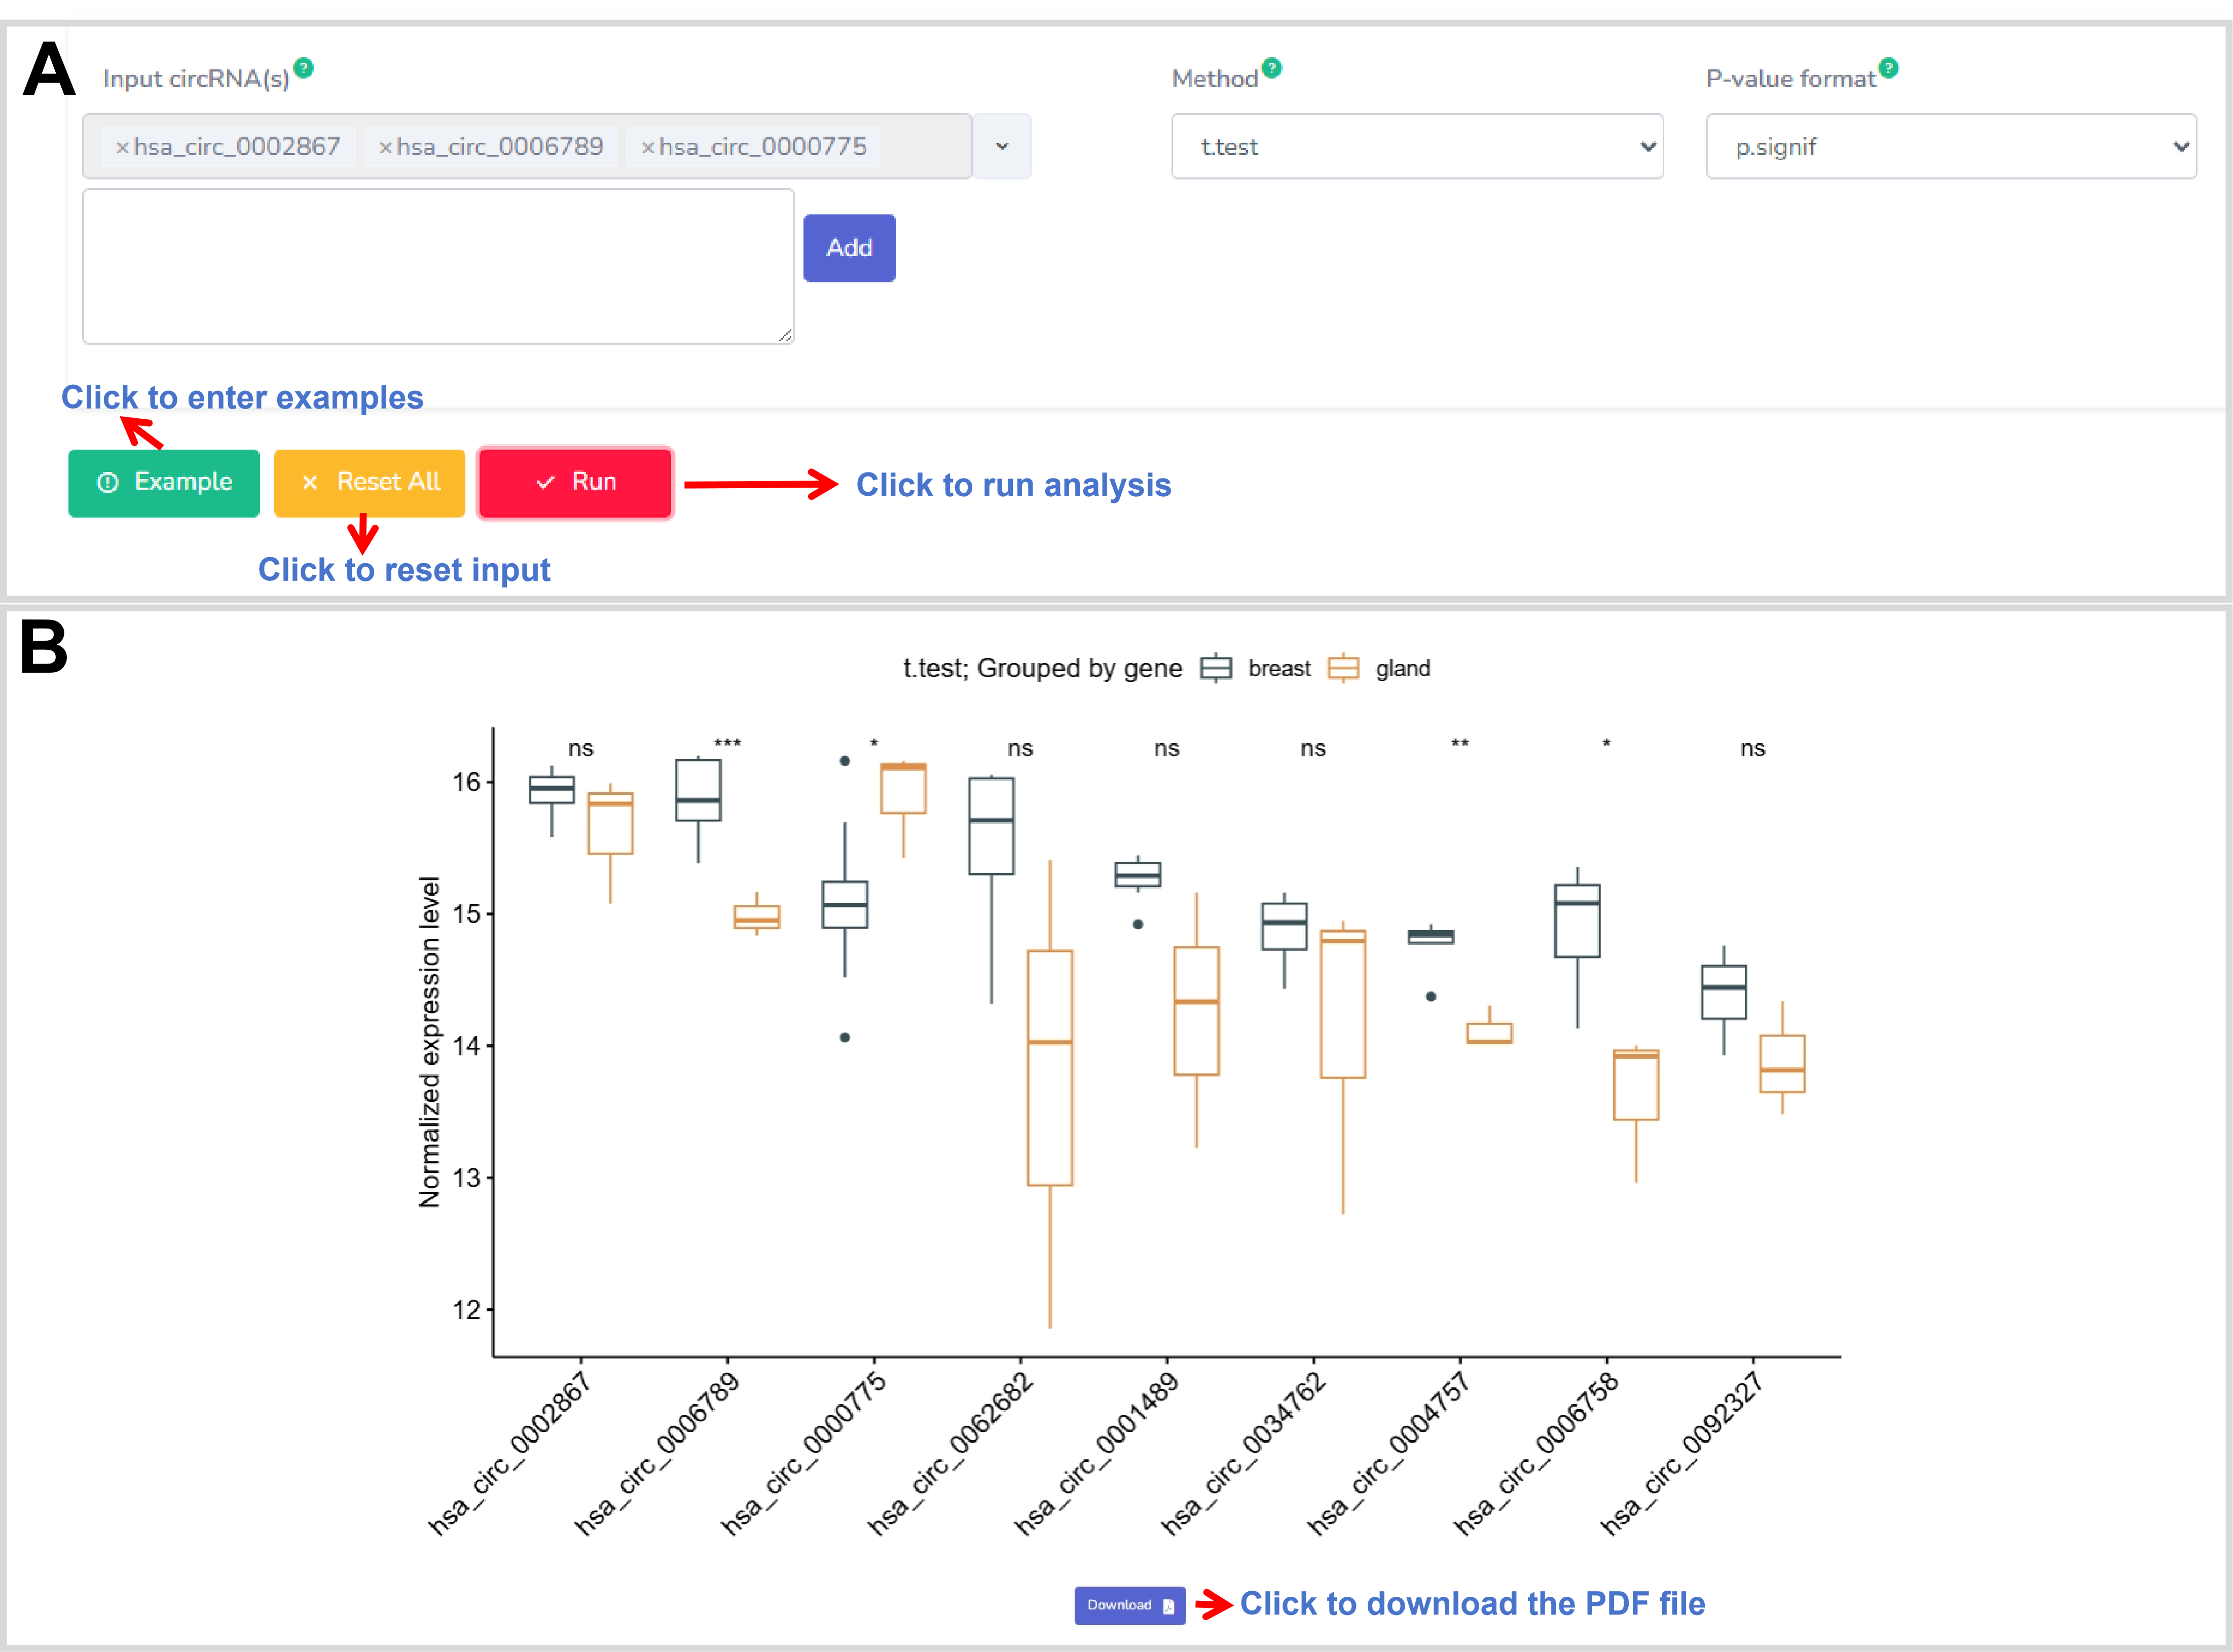
Figure 9. The web interface of the BoxplotUnfacet.
Description:
The BoxplotFacet analysis function aims to draw a box plot with facet to show the
differential expression of one or multiple circRNAs among different pathological or
physiological conditions. The result displays as a box plot (Figure 10), which can
be freely downloaded and saved as a PDF file with high resolution. (na: p>0.05; *:
p<=0.05; **: p<=0.01; ***: p<=0.001; ****: p<=0.0001)
R package(s): The dplyr, reshape2, ggplot2, gridExtra and ggpubr
packages are used for the facet boxplot, involving in the data processes,
differential expression analysis, and boxplot.
Parameter(s): circRNA:circBase ID(s);Method:a method for the differential expression analysis, including t.test, wilcox.test, anova, and kruskal.test; P-value format: a format of p-value for displaying.
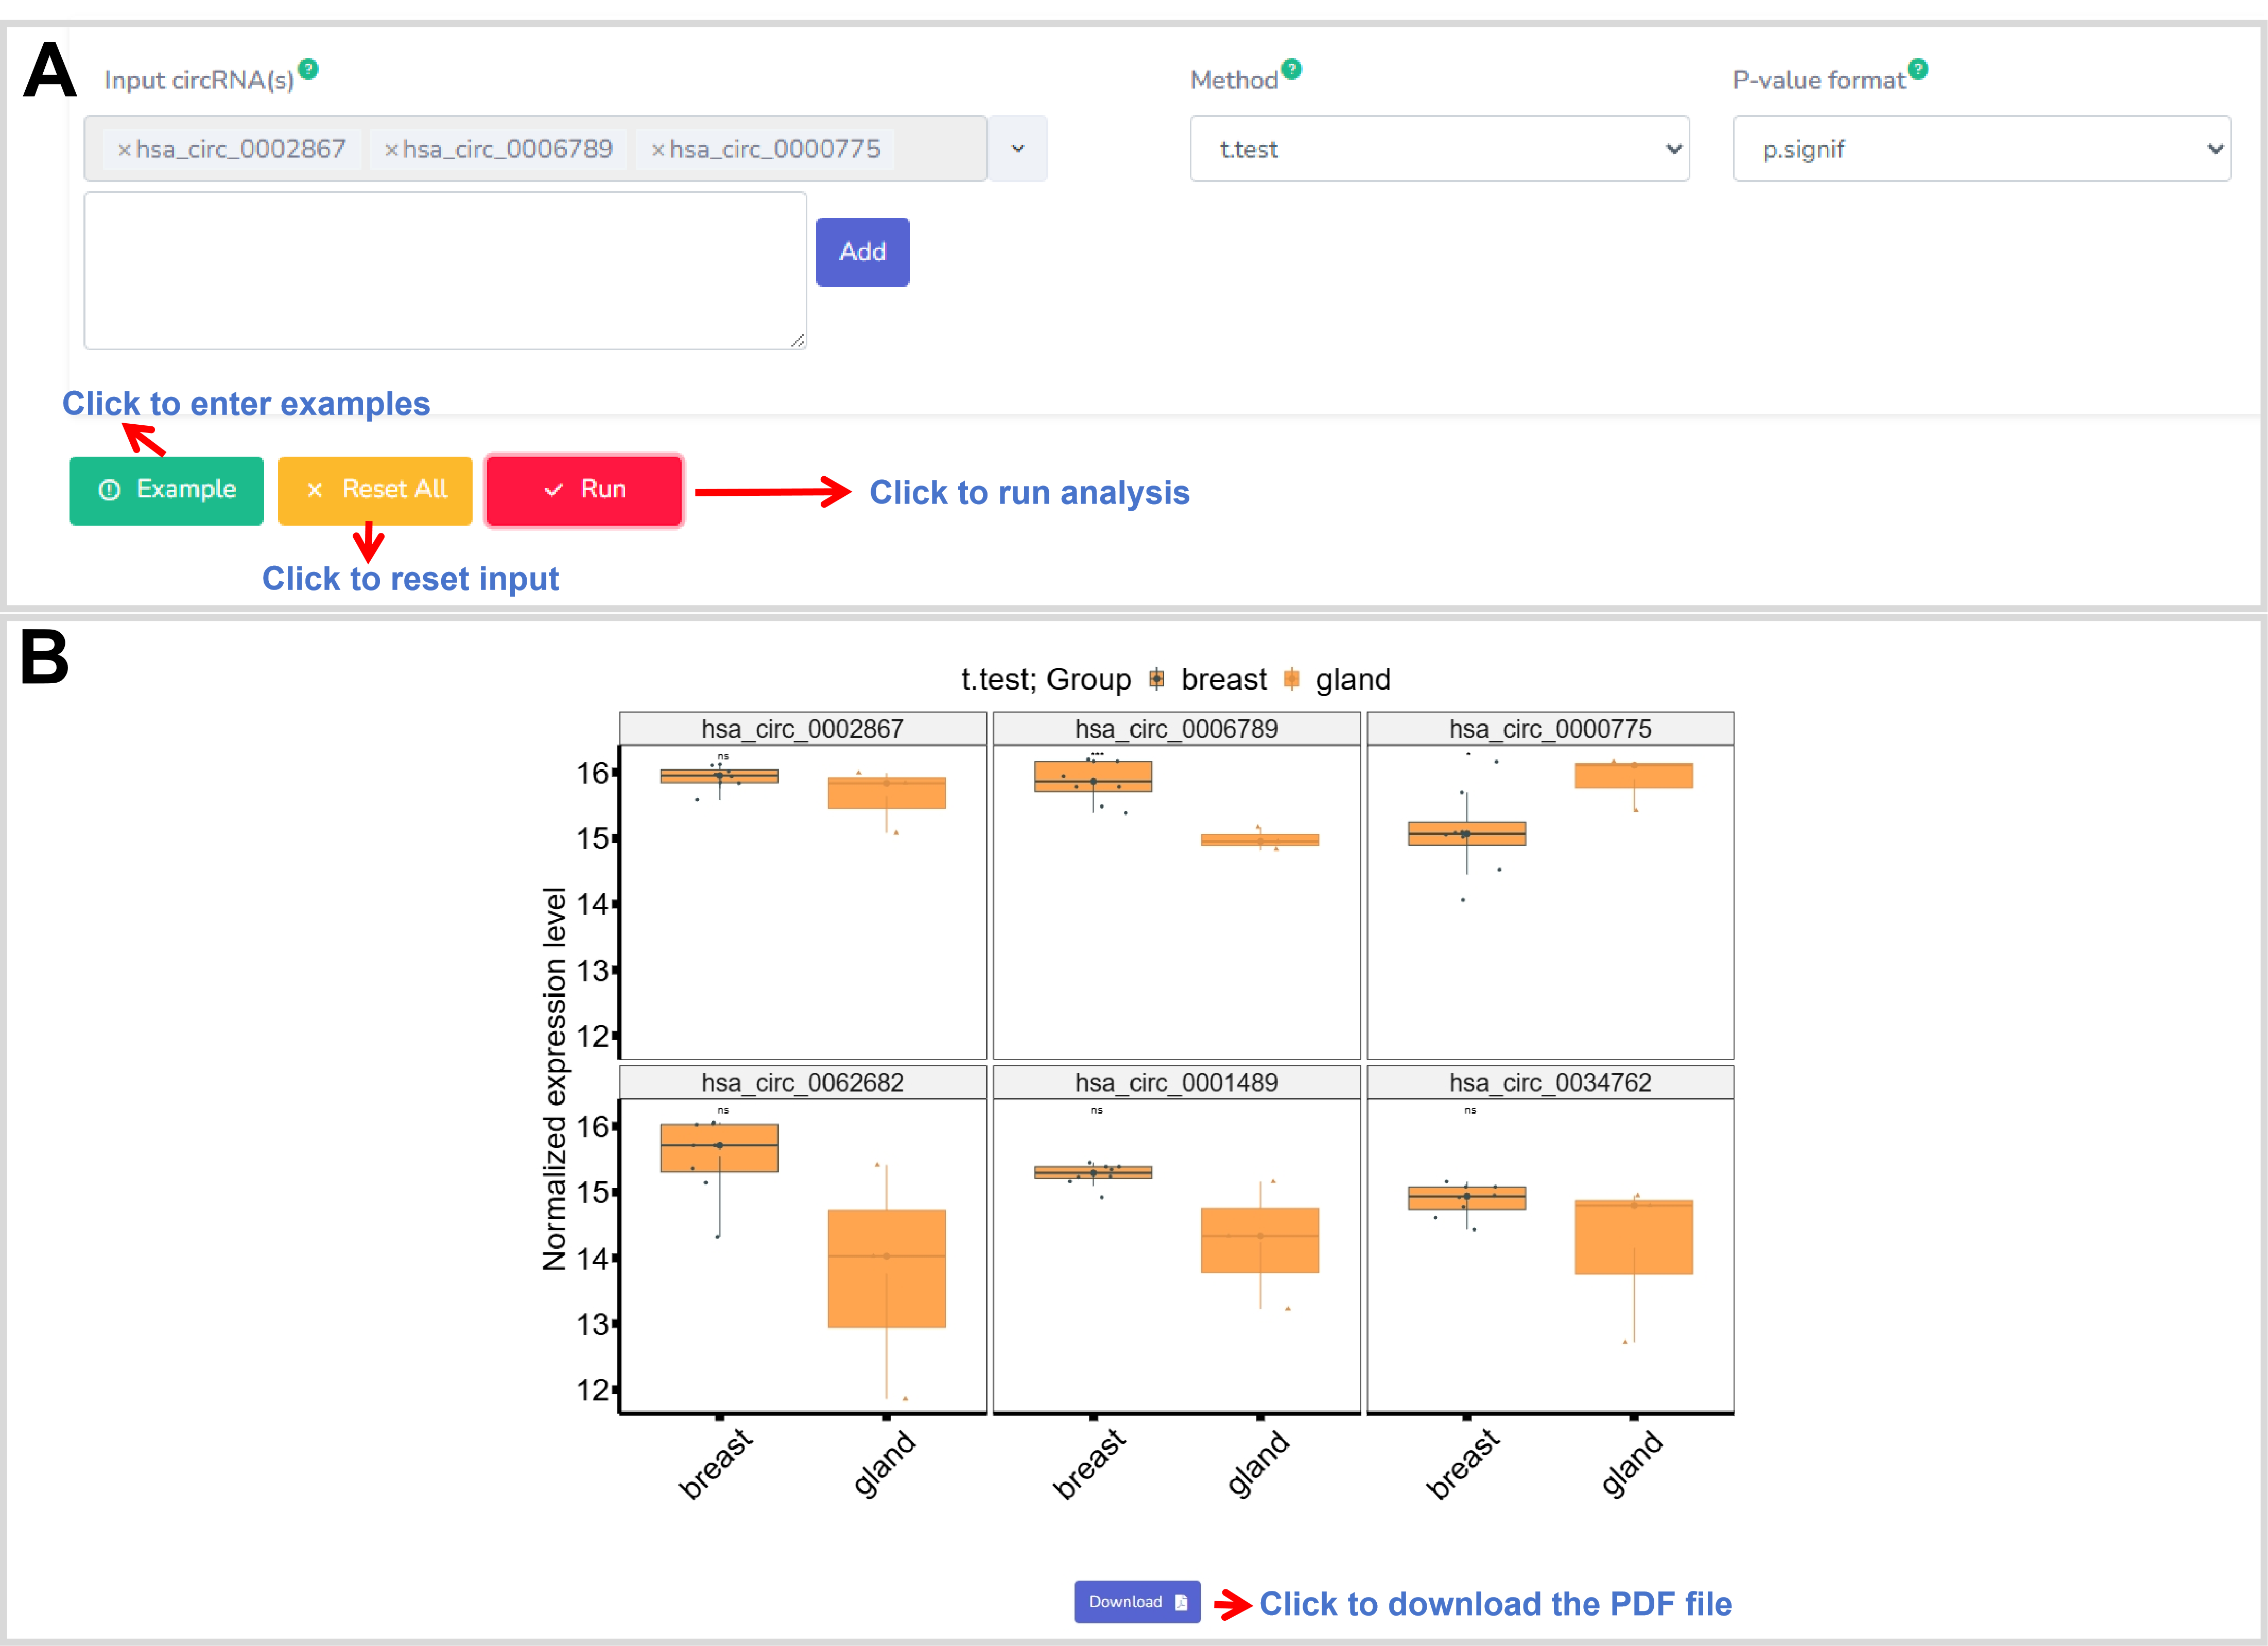
Figure 9. The web interface of the BoxplotFacet.
Description:
The VolcanoPlot is a helpful analysis to depict the significant difference of one or
more circRNAs among different physiological and pathological conditions. The result
displays as a volcano plot (Figure 11), which can be freely downloaded and saved as
a PDF file with high resolution.
R package(s): The dplyr, limma, and ggplot2 packages are used
for the volcano plot,
involving in the data processes, differential expression analysis, and volcano plot.
Parameter(s): circRNA:circBase ID(s);Log2FC cutoff:a threshold value of log2FC (two-folds change) to define the significant differential circRNA;p-value cutoff:a threshold p-value to define the significant differential circRNA.
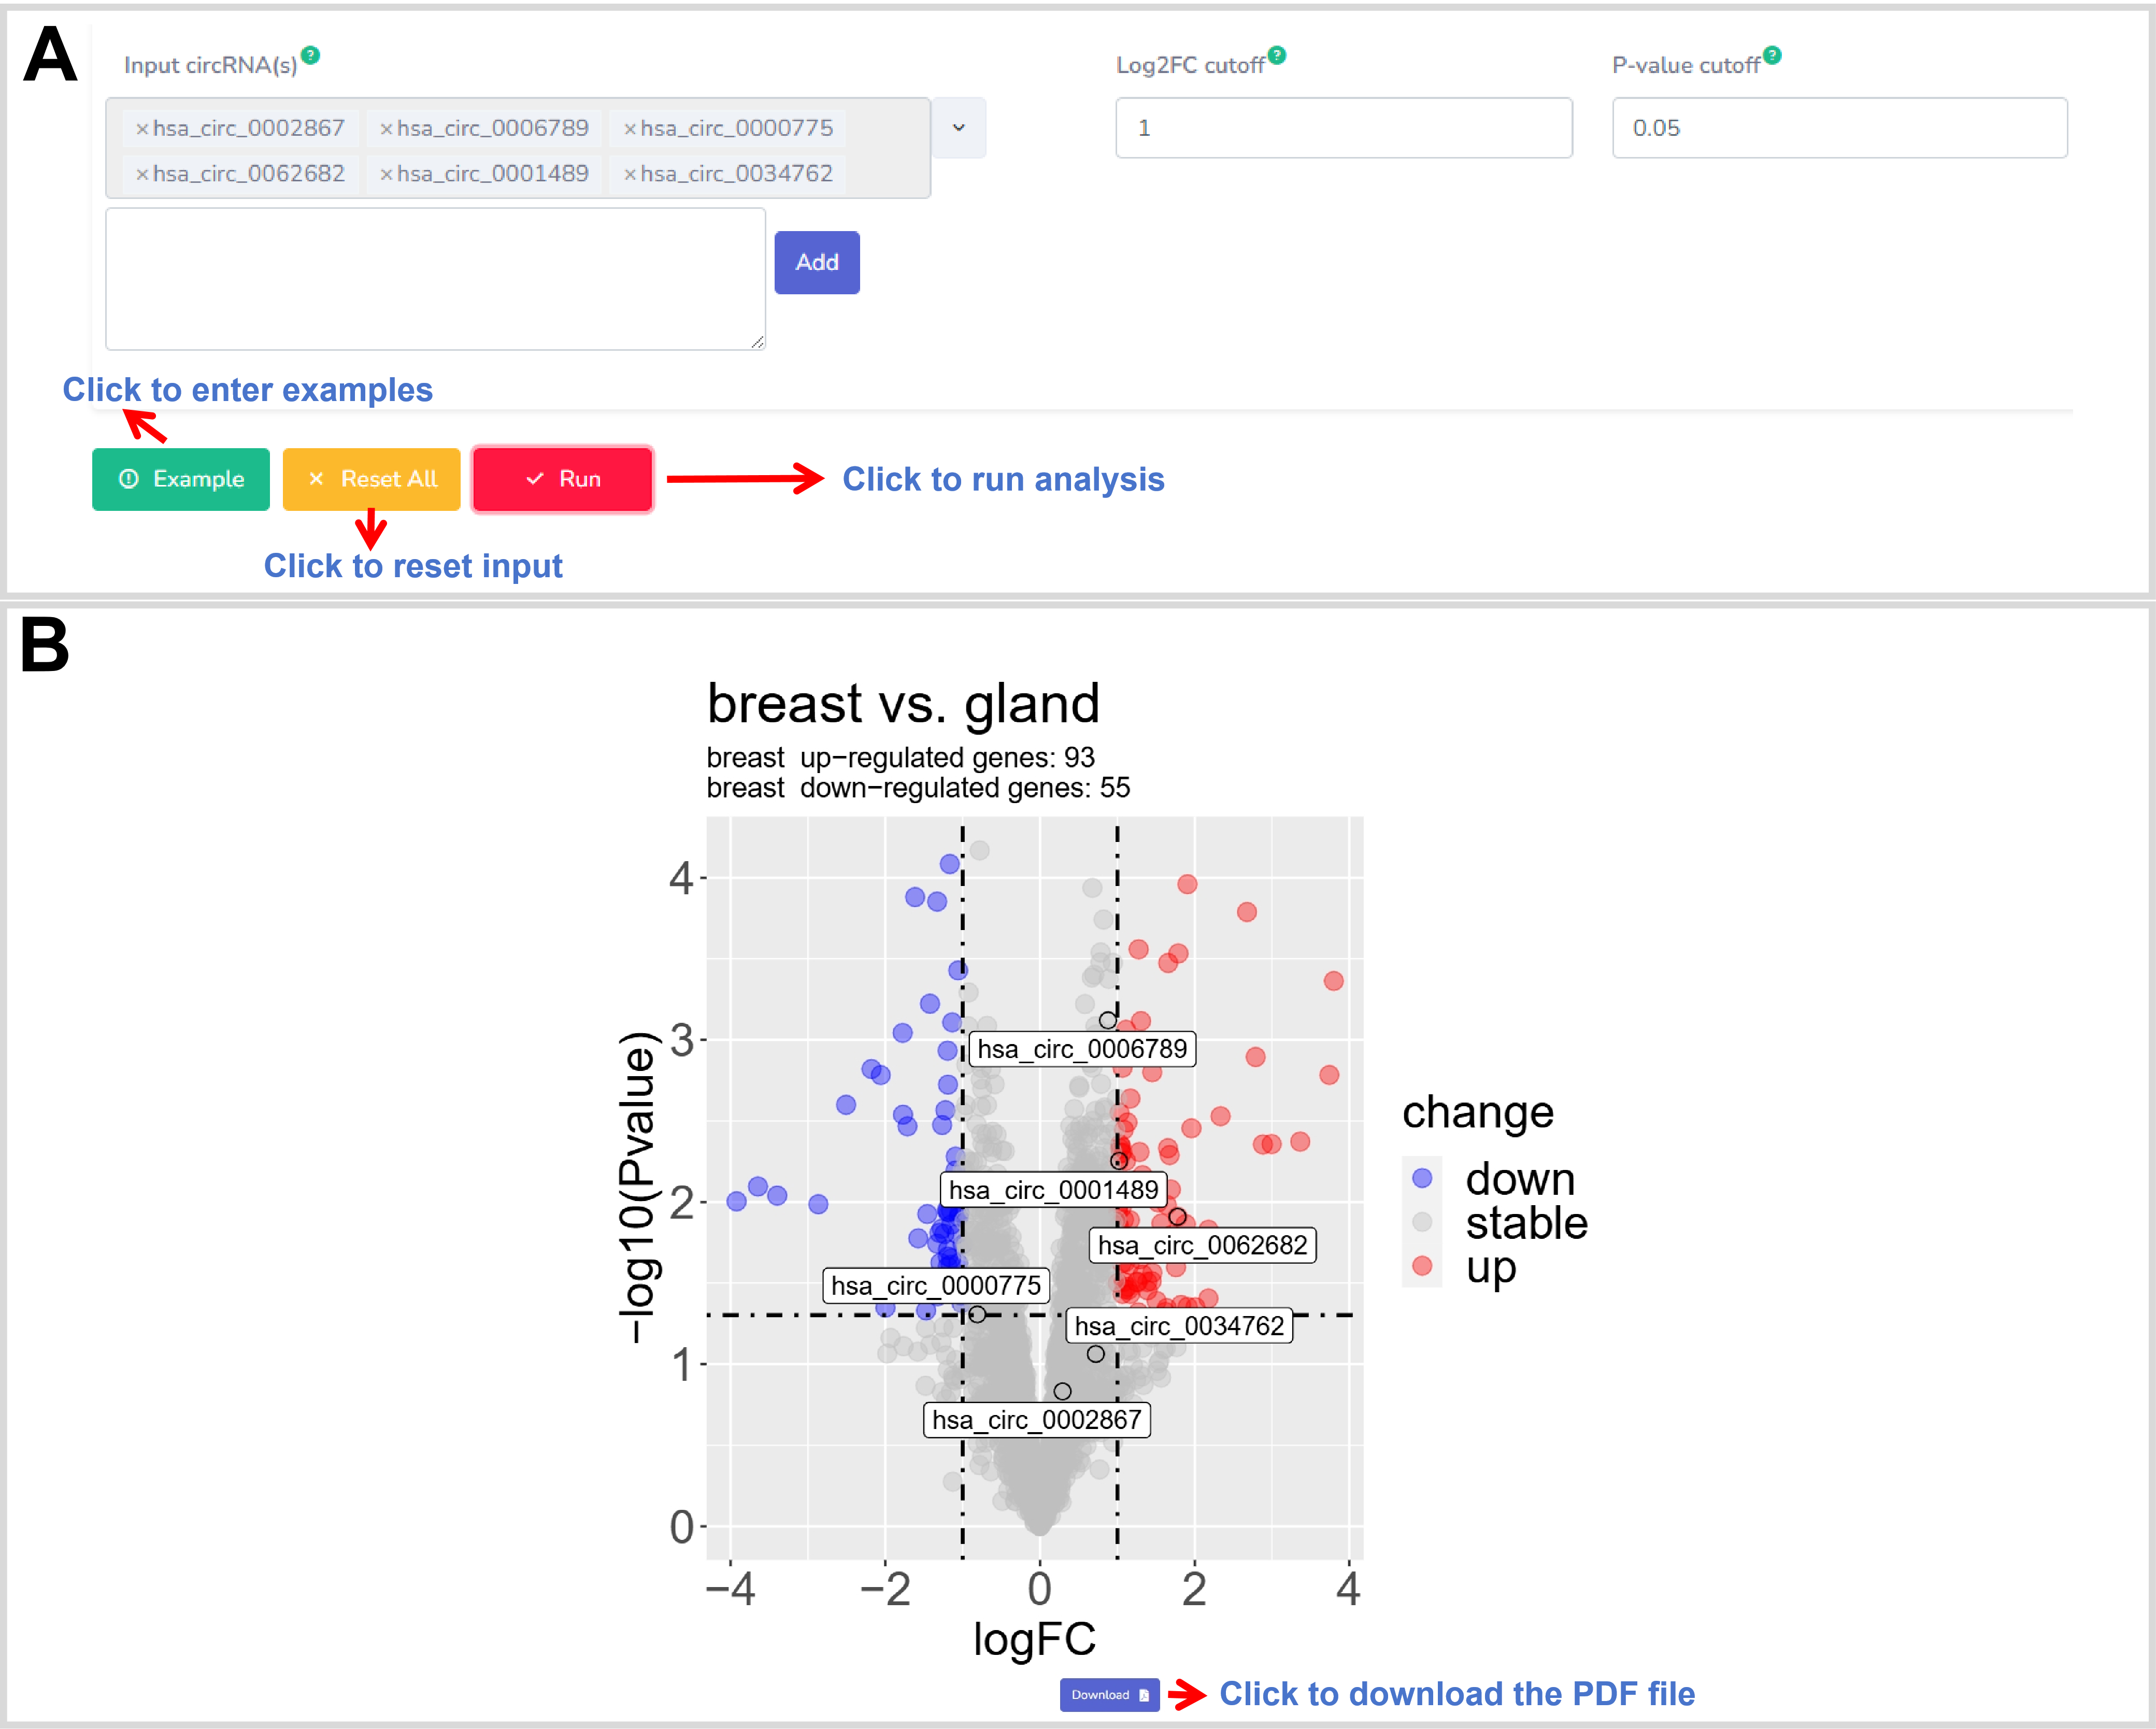
Figure 11. The web interface of the VolcanoPlot.
Description: The Heatmap aims to draw a heatmap plot for the
interesting circRNAs. Multiple methods are provided to draw the heatmap plot. The
result displays as a heatmap plot, which can be freely downloaded and saved as a PDF
file with high resolution (Figure 12).
R package(s): The dplyr, jsonlite, pheatmap, and
ggplot2 packages are used for the data processes and heatmap plot,
respectively.
Parameter(s): circRNA(s):at least two circBase IDs;Method:a method for the heatmap plot, including ward.D, ward.D2, single, complete, average, mcquitty, media, and centroid.
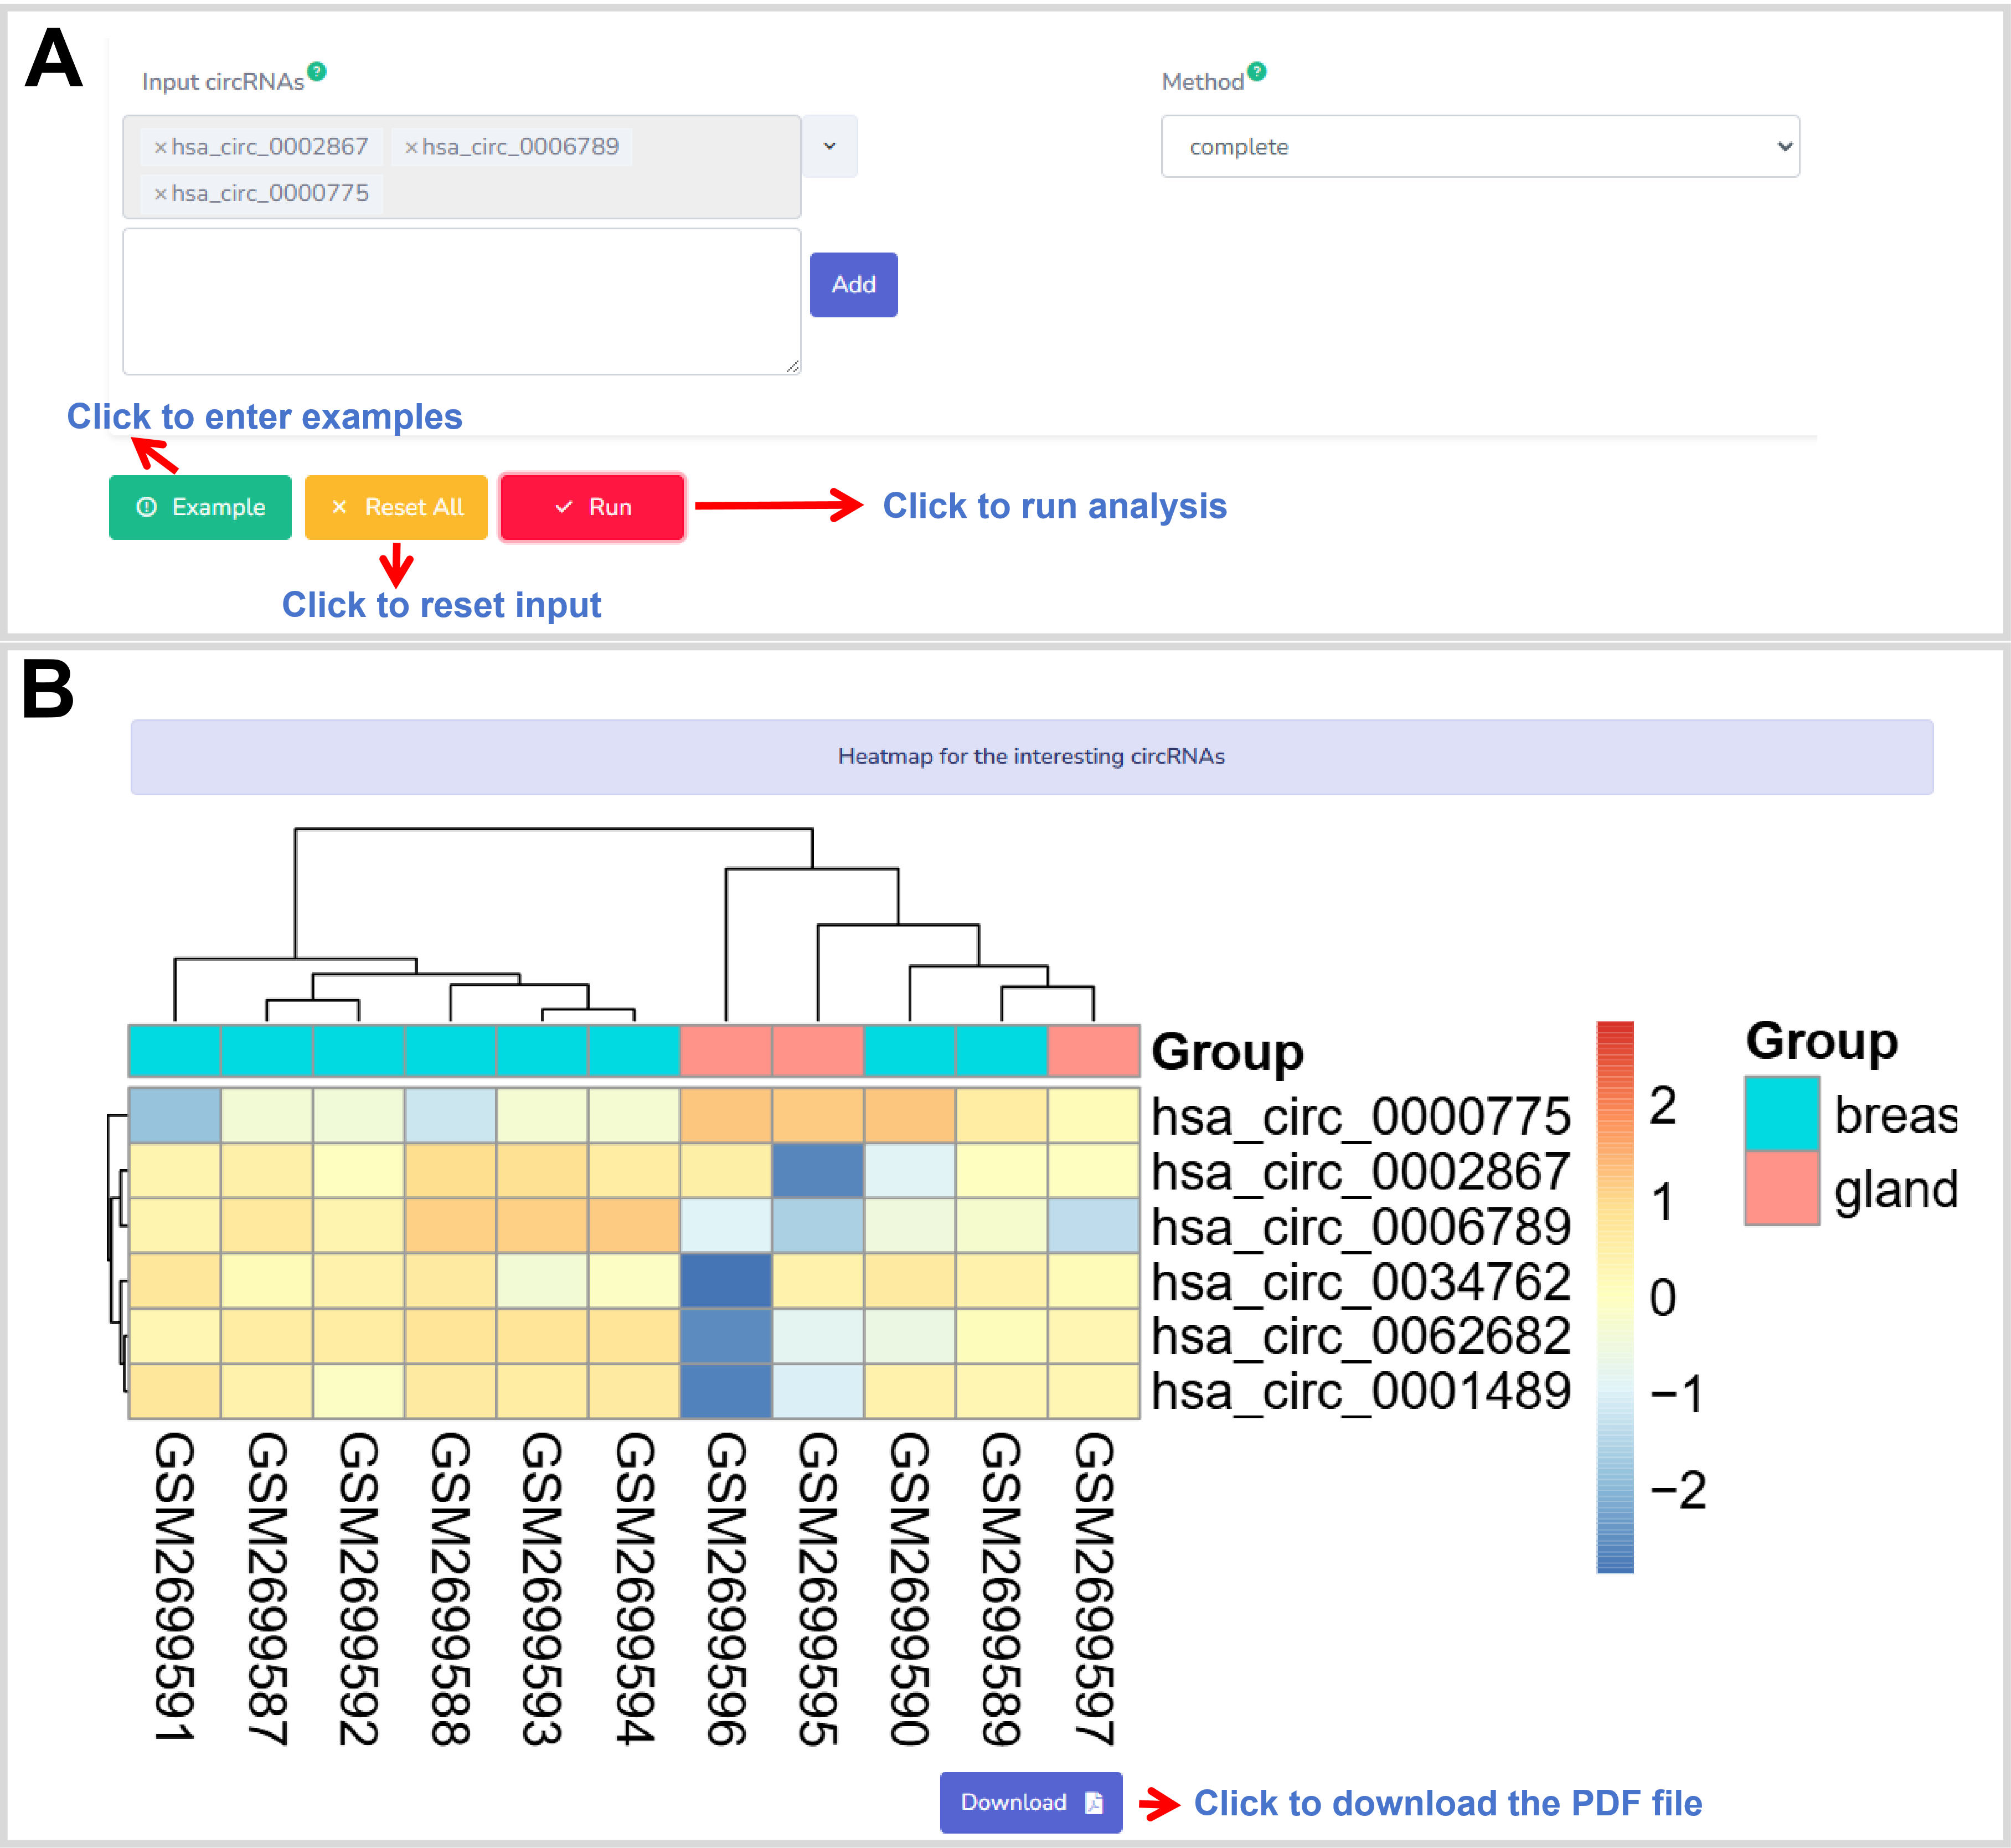
Figure 12. The web interface of the Heatmap plot.
Description:
The GO enrichment in the differential expression module aims to perform the Gene
Ontology (GO) enrichment analysis on the significant differential circRNAs based on
the annotations of their host genes in the GO resource. The results are displayed as
a table and various figures. The plots can be freely download and saved as a PDF
file with high resolution (Figure 13). A menu at the table header can be used to set
columns and rows to show interesting information (Figure 13). The filter box allows
to quick search. In addition, right clicking on the table body displays an
instruction form to copy and export the table (Figure 13). Moreover, the GO ID links
to the GO resource for the detail information of the GO term.
R package(s): The dplyr, jsonlite, stringr, limma, ggplot2,
clusterProfiler, org.Hs.eg.db, topGO, and Rgraphviz packages are used for the
GO enrichment analysis, involving in
the data processes, differential expression analysis, dot plot, and bar plot.
Parameter(s): Log2FC cutoff:a threshold value of log2FC (fold changes) to define the significant differential circRNA;p-value cutoff:a threshold p-value to define the significant differential circRNA;Dysregulation type:including All (all dysregulation circRNA), Up (up-regulation circRNA), and Down (down-regulation circRNA);GO-p-value:a threshold p-value for the enriched GO term;GO-q-value:a threshold q-value for the enriched GO term;GO-type:including All (all GO terms), BC (biological processes GO terms), CC (cell components GO terms), and MF (molecular functions GO terms).
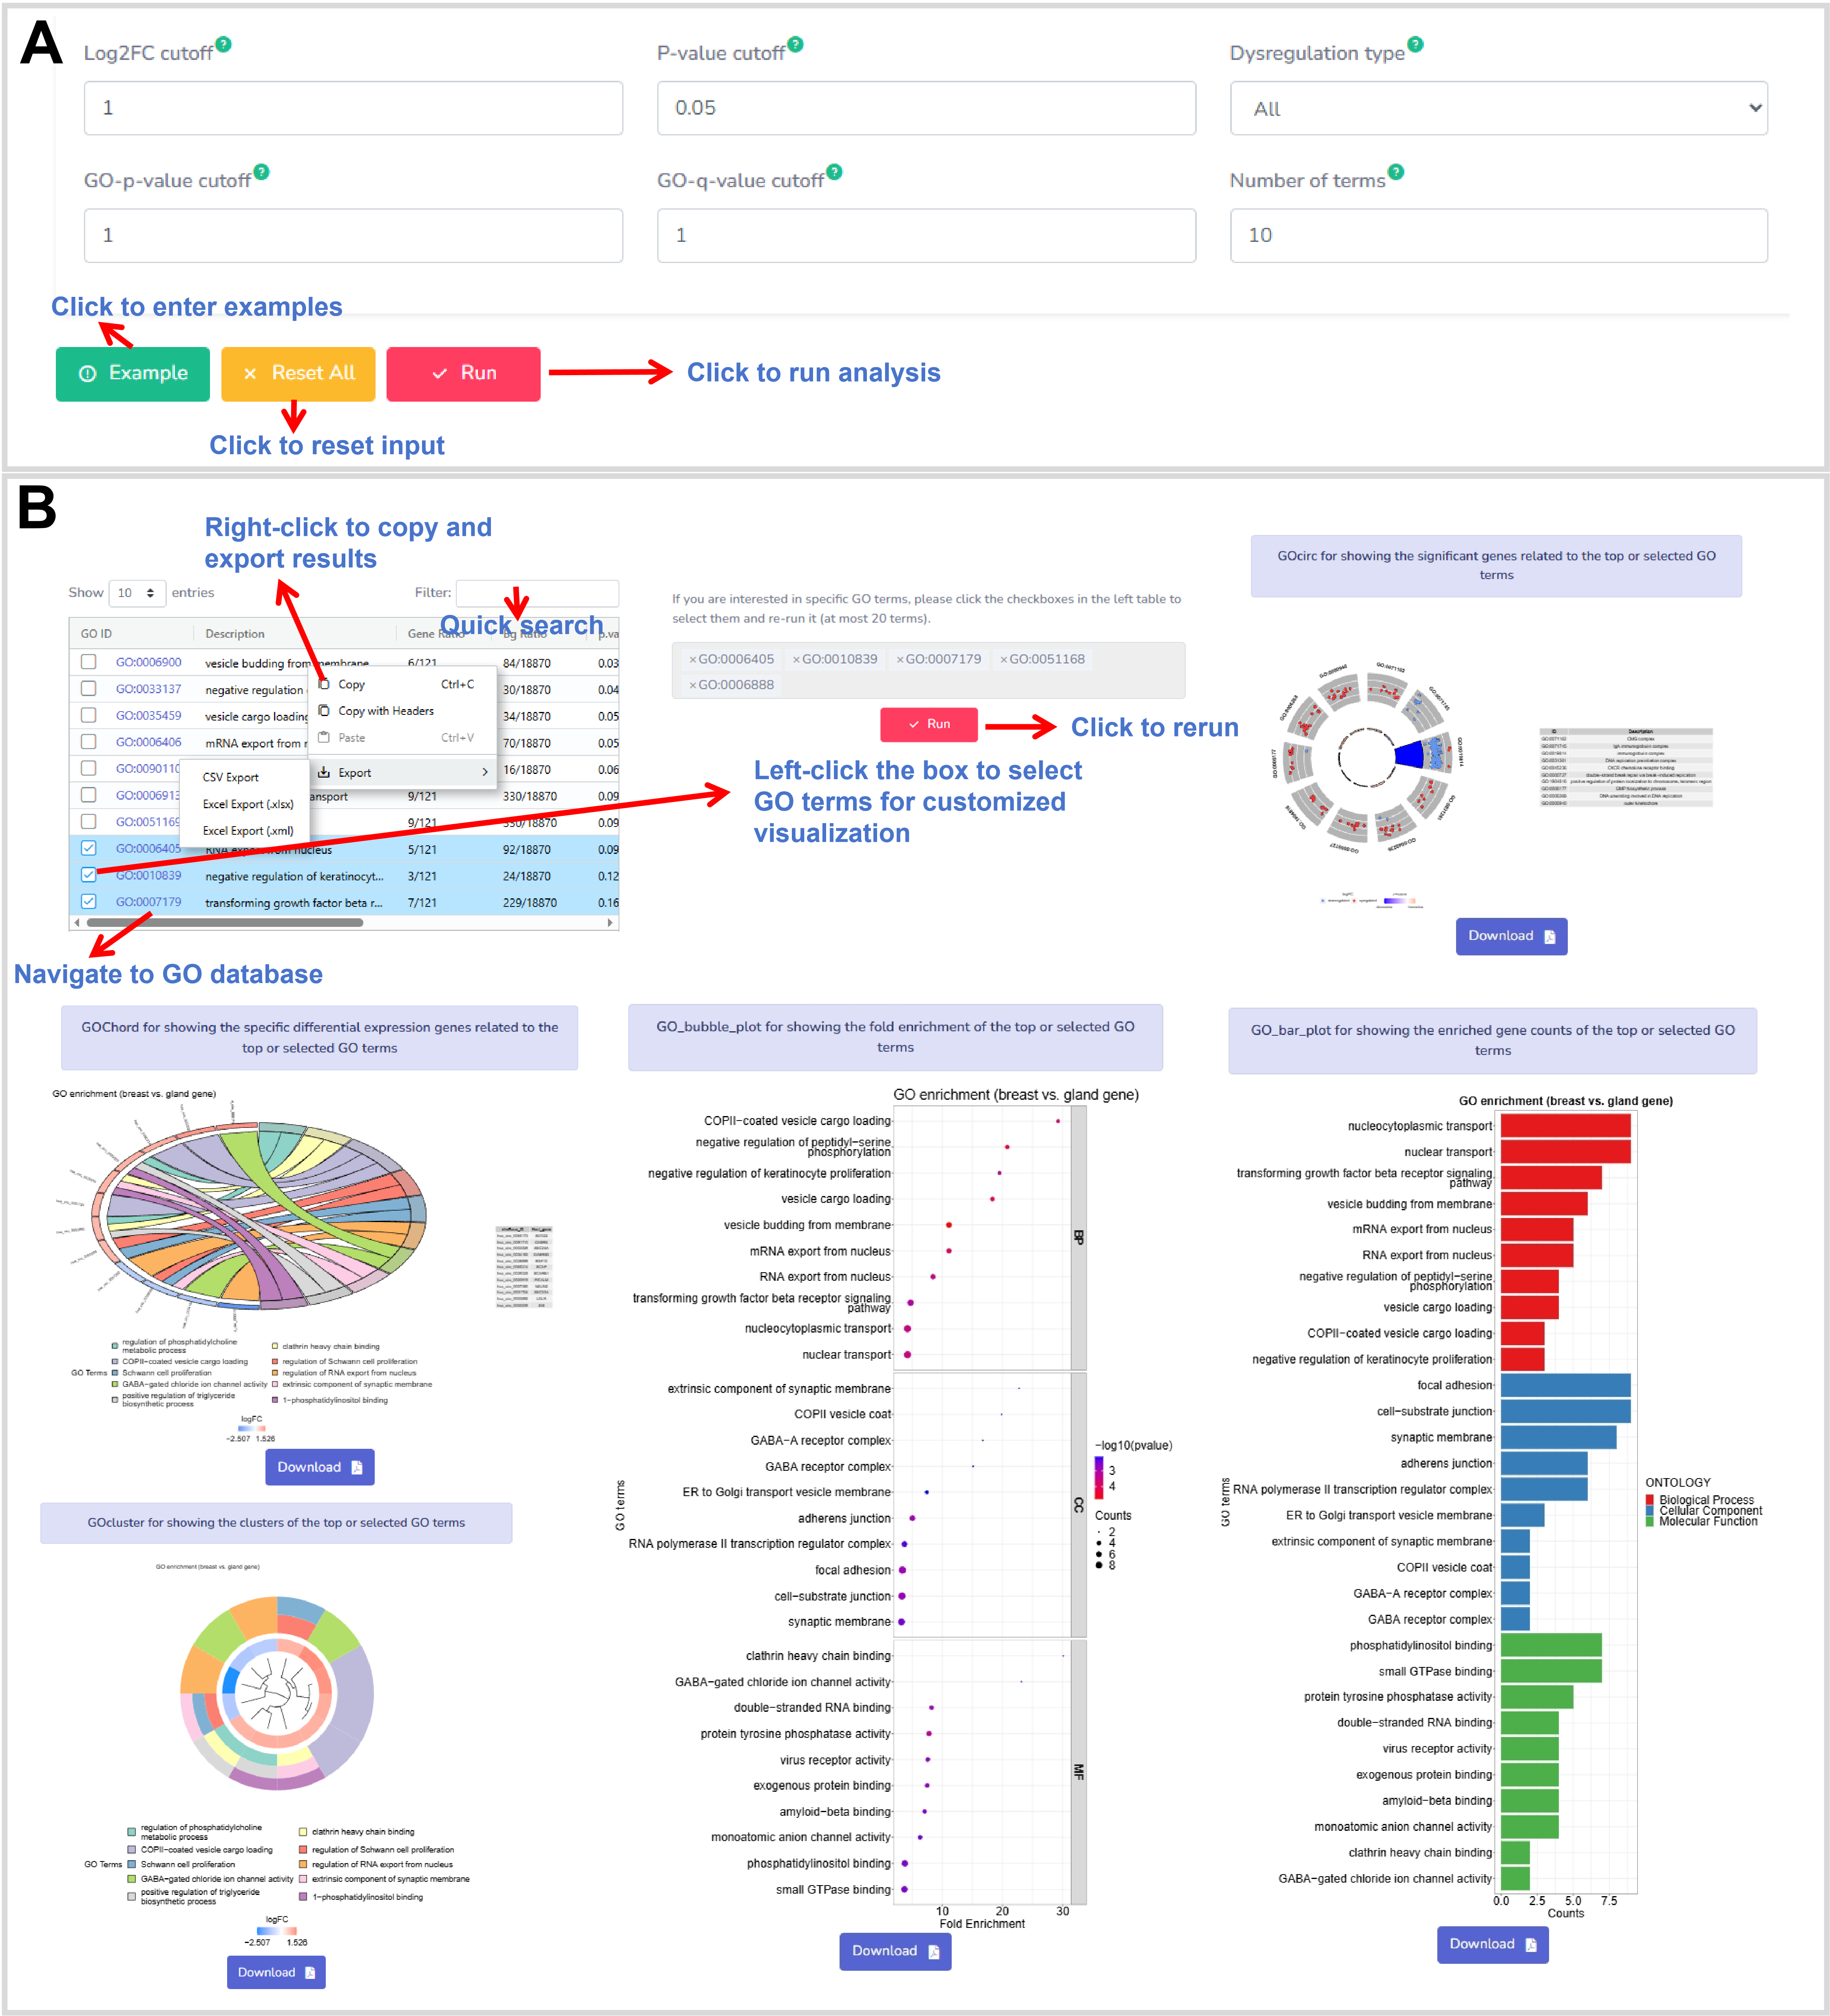
Figure 13. The web interface of the GO enrichment.
Description:
The GO GSEA analysis function aims to build a Gene Set Enrichment Analysis (GSEA) to
determine whether a set of significant circRNAs show statistically significant and
concordant differences between different physiological and pathological condition,
based on their host genes annotated in the Gene Ontology (GO) resource (Figure 14).
The results are displayed as a table and various figures. The figures can be freely
download and saved as a PDF file with high resolution. A menu at the table header
can be used to set columns and rows to show the interesting information. The filter
box allows to quick search. In addition, right clicking on the table body displays
an instruction form to copy and export the table. Moreover, the GO ID links to the
GO resource for the detail information of the GO term.
R package(s): The dplyr, jsonlite, stringr, limma, ggplot2,
clusterProfiler, orgDbs, topGO, and Rgraphviz packages are used for the GO GSEA
enrichment analysis, involving in the data processes, differential expression
analysis and visualization.
Parameter(s): Log2FC cutoff:a threshold value of log2FC (two-folds change) to define the significant differential circRNA;p-value cutoff:a threshold p-value to define the significant differential circRNA;Dysregulation type:including All (all dysregulation gene feature ), Up (up-regulation gene feature), and Down (down-regulation gene feature);GO-p-value:a threshold p-value for the enriched GO term;GO-q-value:a threshold q-value for the enriched GO term;Number of terms:a number of the GO terms to show.
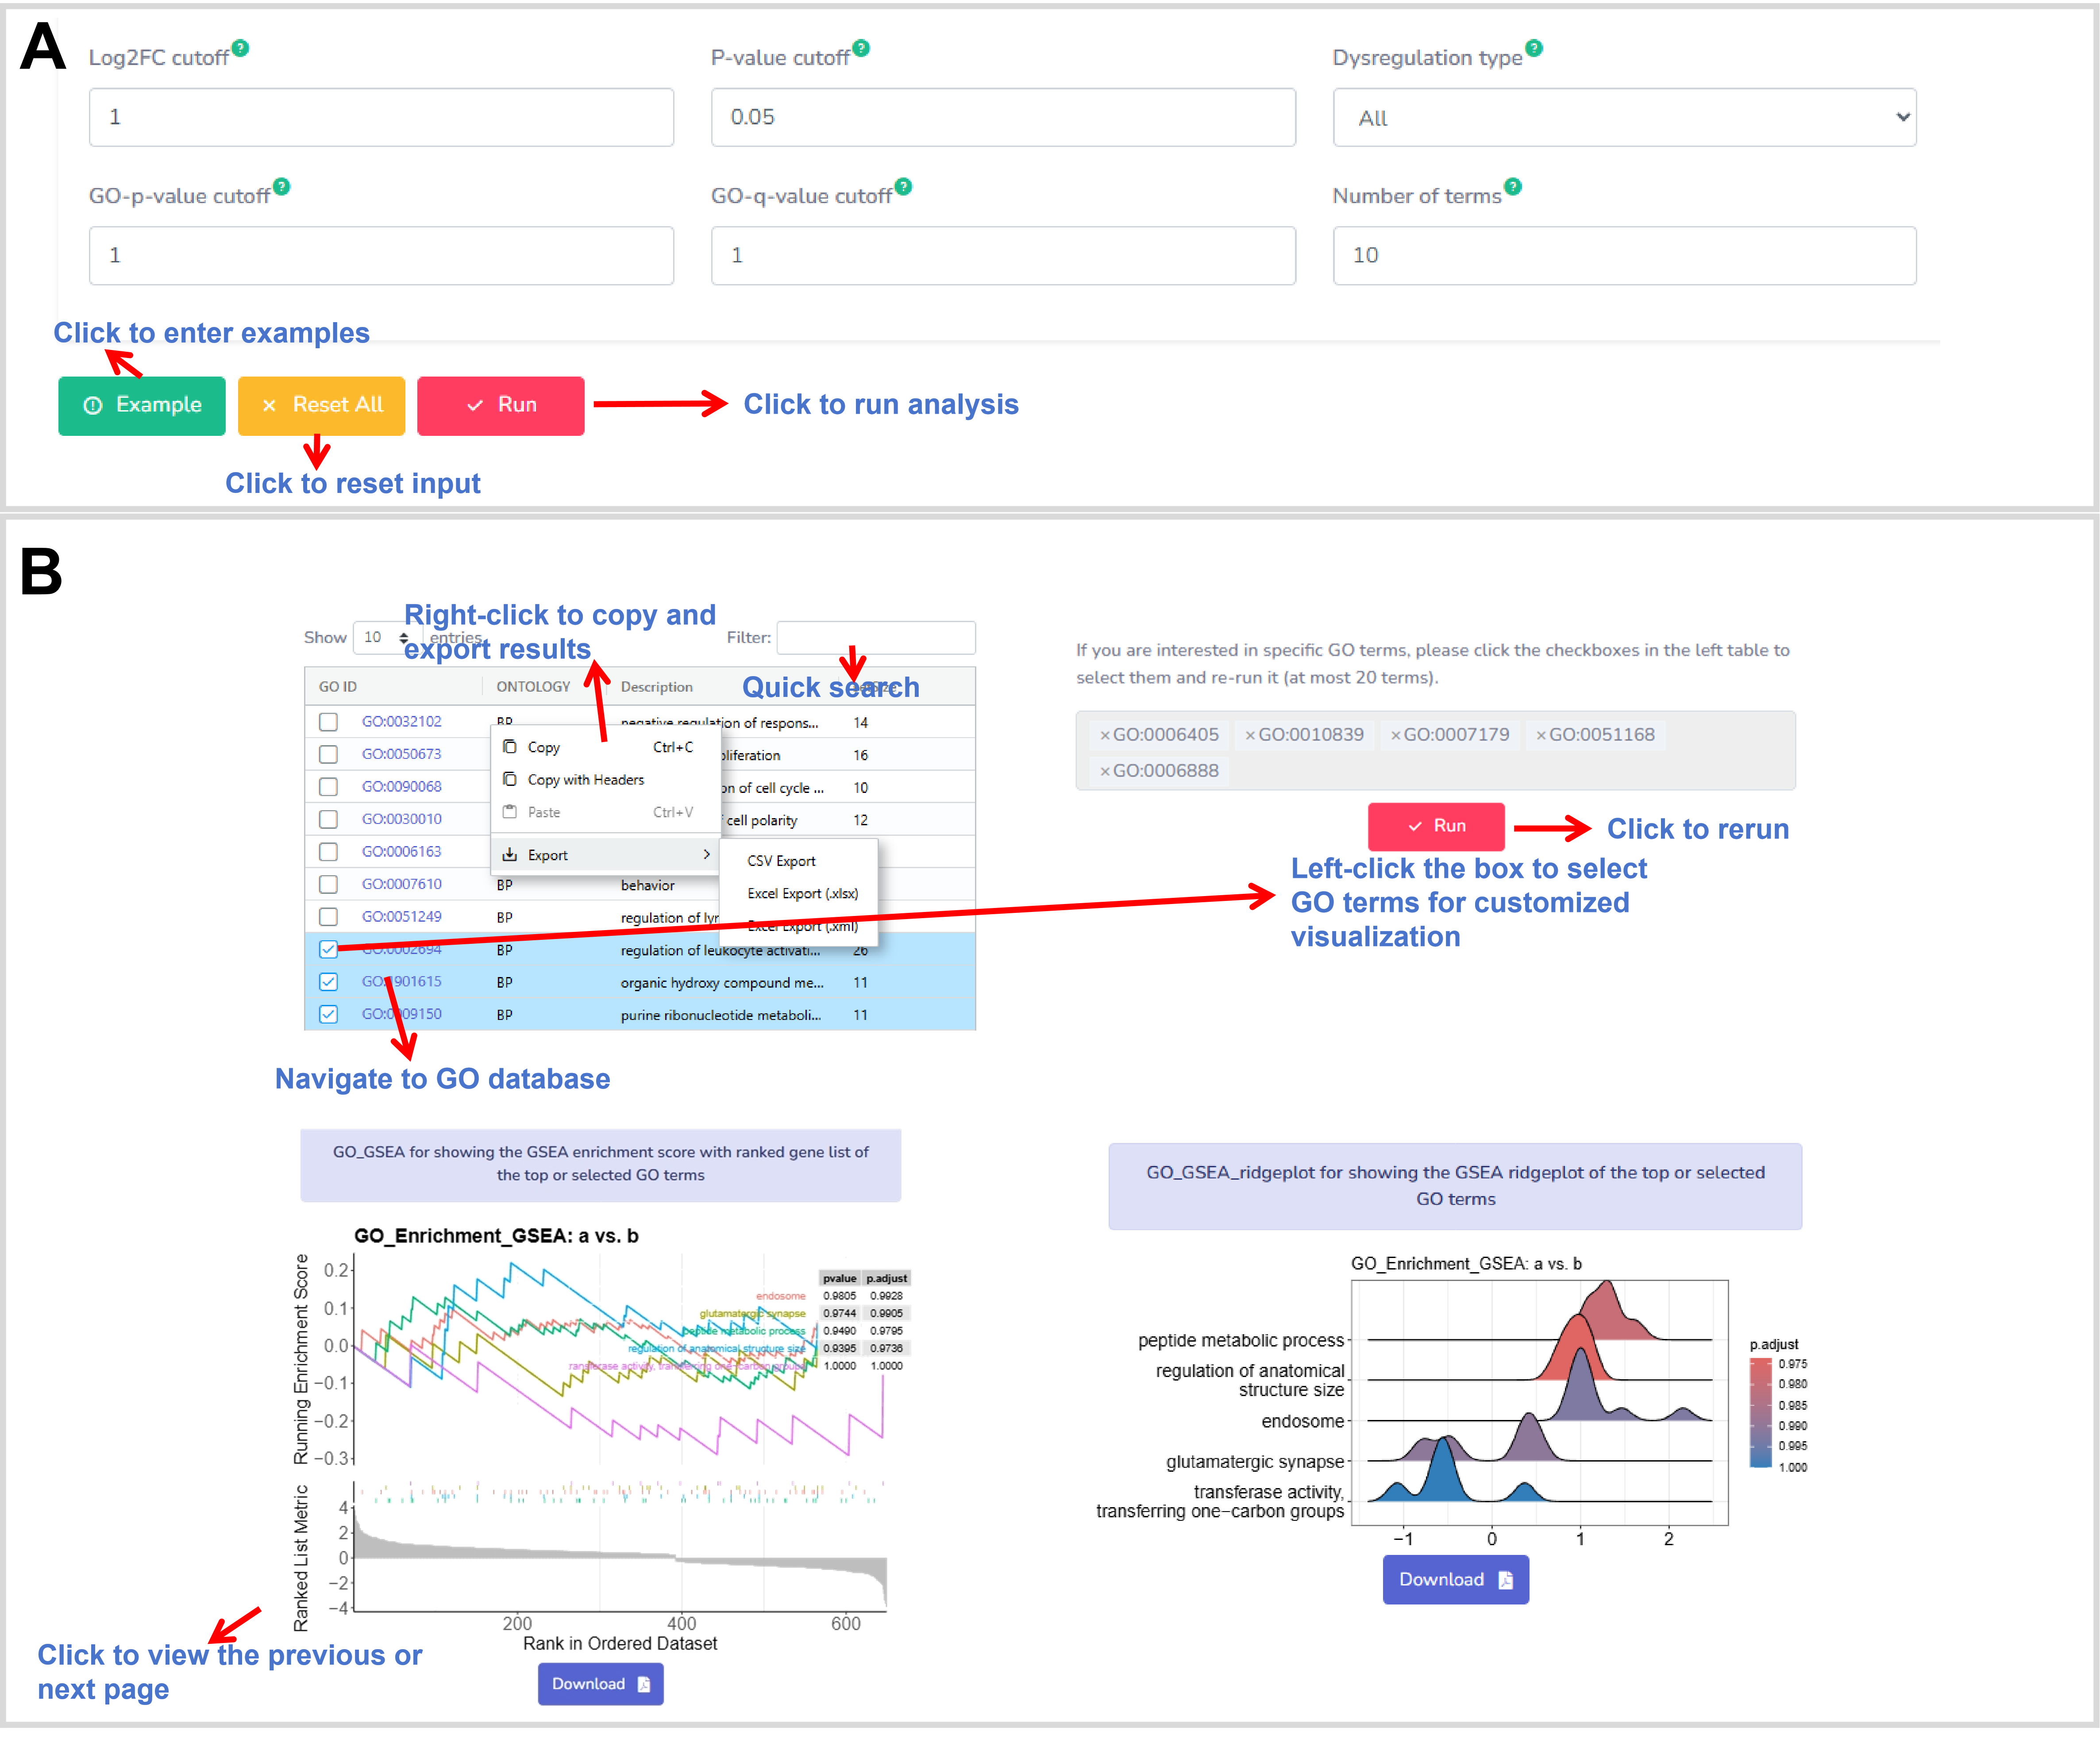
Figure 14. The web interface of the GO GSEA.
Description:
The KEGG enrichment in the differential expression module is a helpful application
to conduct the pathway analysis on the significant differential circRNAs based on
the annotations of their host genes in the KEGG resource. The results are displayed
as a table and various figures. The plots can be freely download and saved as a PDF
file with high resolution (Figure 15). A menu at the table header can be used to set
columns and rows to show interesting information (Figure 15). The filter box allows
to quick search. In addition, right clicking on the table body displays an
instruction form to copy and export the table (Figure 15). Moreover, the KEGG ID
links to the KEGG resource for the detail information of the KEGG term.
R package(s): The dplyr, jsonlite, stringr, limma, ggplot2,
clusterProfiler, org.Hs.eg.db, Rgraphviz, and pathviewpackages were installed
in the R project and are used for the KEGG enrichment analysis, involving in the
data processes, differential expression analysis, dot plot, and bar plot.
Parameter(s): Log2FC cutoff:a threshold value of log2FC (two-folds change) to define the significant differential circRNA;p-value cutoff:a threshold p-value to define the significant differential circRNA;Dysregulation type:including All (all dysregulation circRNA), Up (up-regulation circRNA), and Down (down-regulation circRNA);KEGG-p-value:a threshold p-value for the enriched KEGG term;KEGG-q-value:a threshold q-value for the enriched KEGG term.
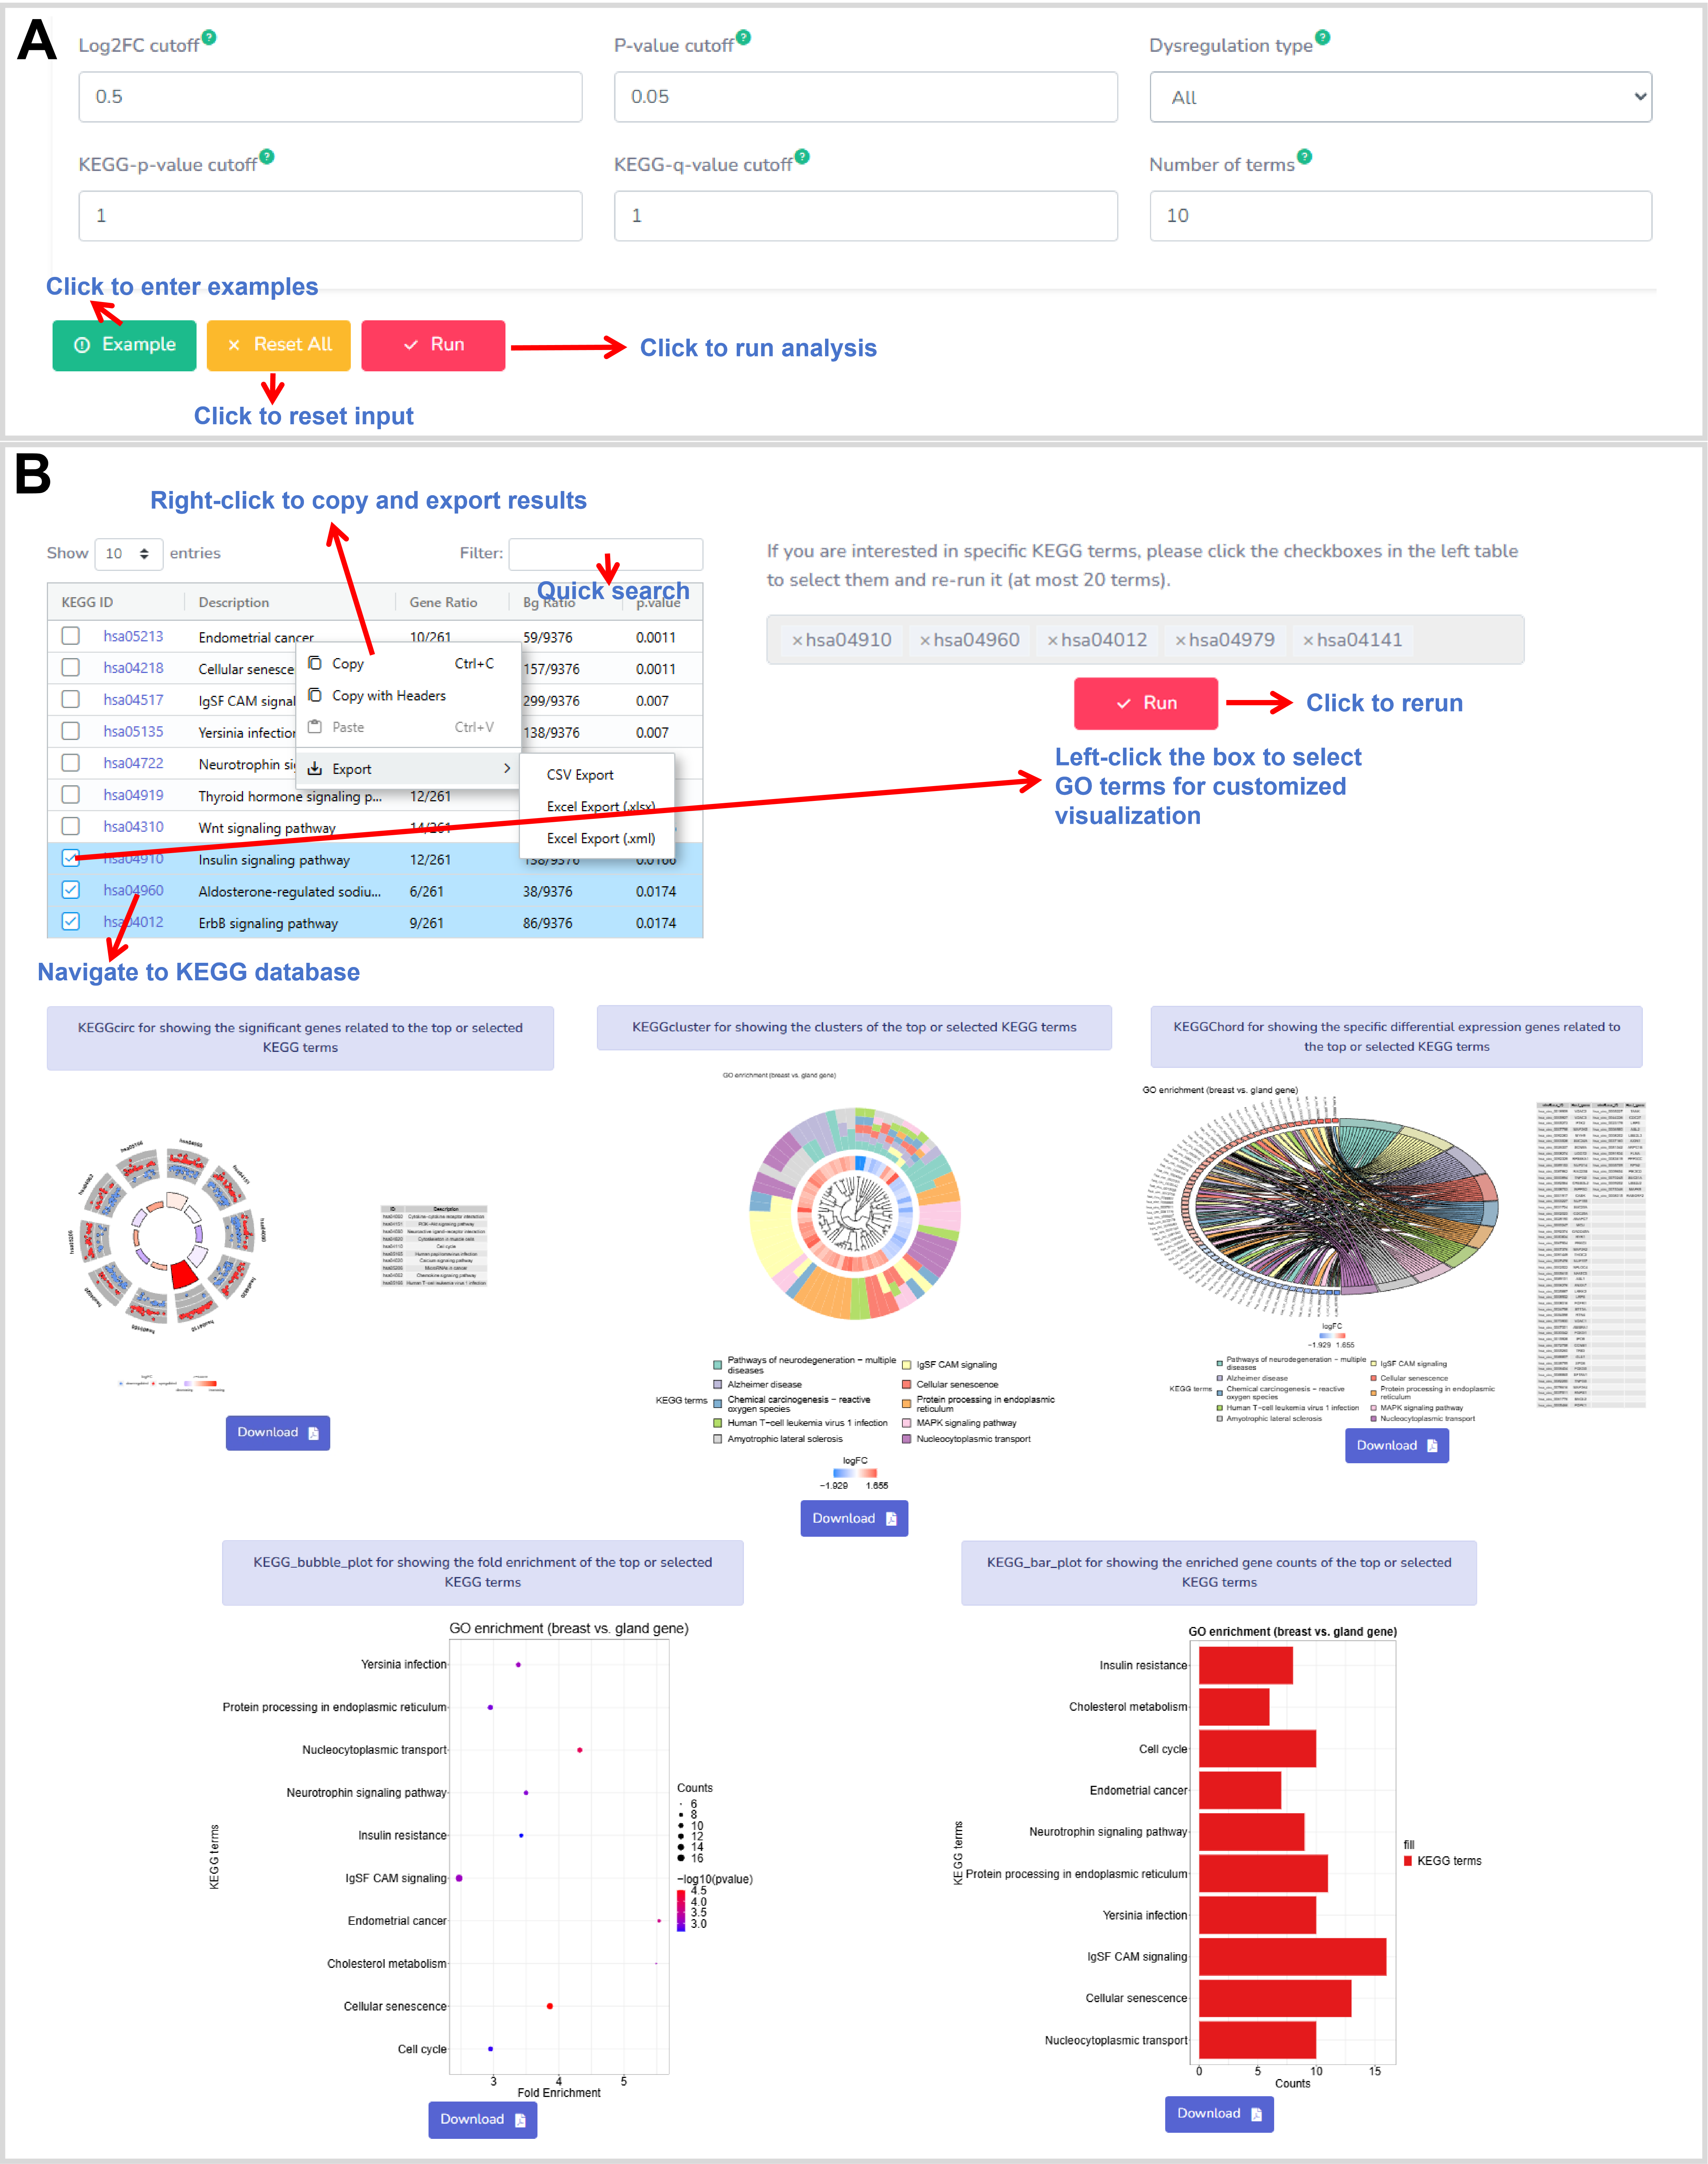
Figure 15. The web interface of the KEGG enrichment.
Description:
The KEGG GSEA analysis function aims to build a Gene Set Enrichment Analysis (GSEA)
to determine whether a set of significant circRNAs show statistically significant
and concordant differences between different physiological and pathological
condition, based on their host genes annotated in the KEGG resource (Figure 16). The
results are displayed as a table and various figures. The figures can be freely
download and saved as a PDF file with high resolution. A menu at the table header
can be used to set columns and rows to show the interesting information. The filter
box allows to quick search. In addition, right clicking on the table body displays
an instruction form to copy and export the table. Moreover, the KEGG ID links to the
KEGG resource for the detail information of the KEGG term.
R package(s): The dplyr, jsonlite, stringr, limma, ggplot2,
clusterProfiler, orgDbs, topGO, and Rgraphviz packages are used for the KEGG GSEA
enrichment analysis, involving in the data processes, differential expression
analysis and visualization.
Parameter(s): Log2FC cutoff:a threshold value of log2FC (two-folds change) to define the significant differential circRNAs;p-value cutoff:a threshold p-value to define the significant differential circRNA;Dysregulation type:including All (all dysregulation gene feature ), Up (up-regulation gene feature), and Down (down-regulation gene feature);¬KEGG-p-value:a threshold p-value for the enriched KEGG term;KEGG-q-value:a threshold q-value for the enriched KEGG term.Number of terms:a number of the KEGG terms to show.
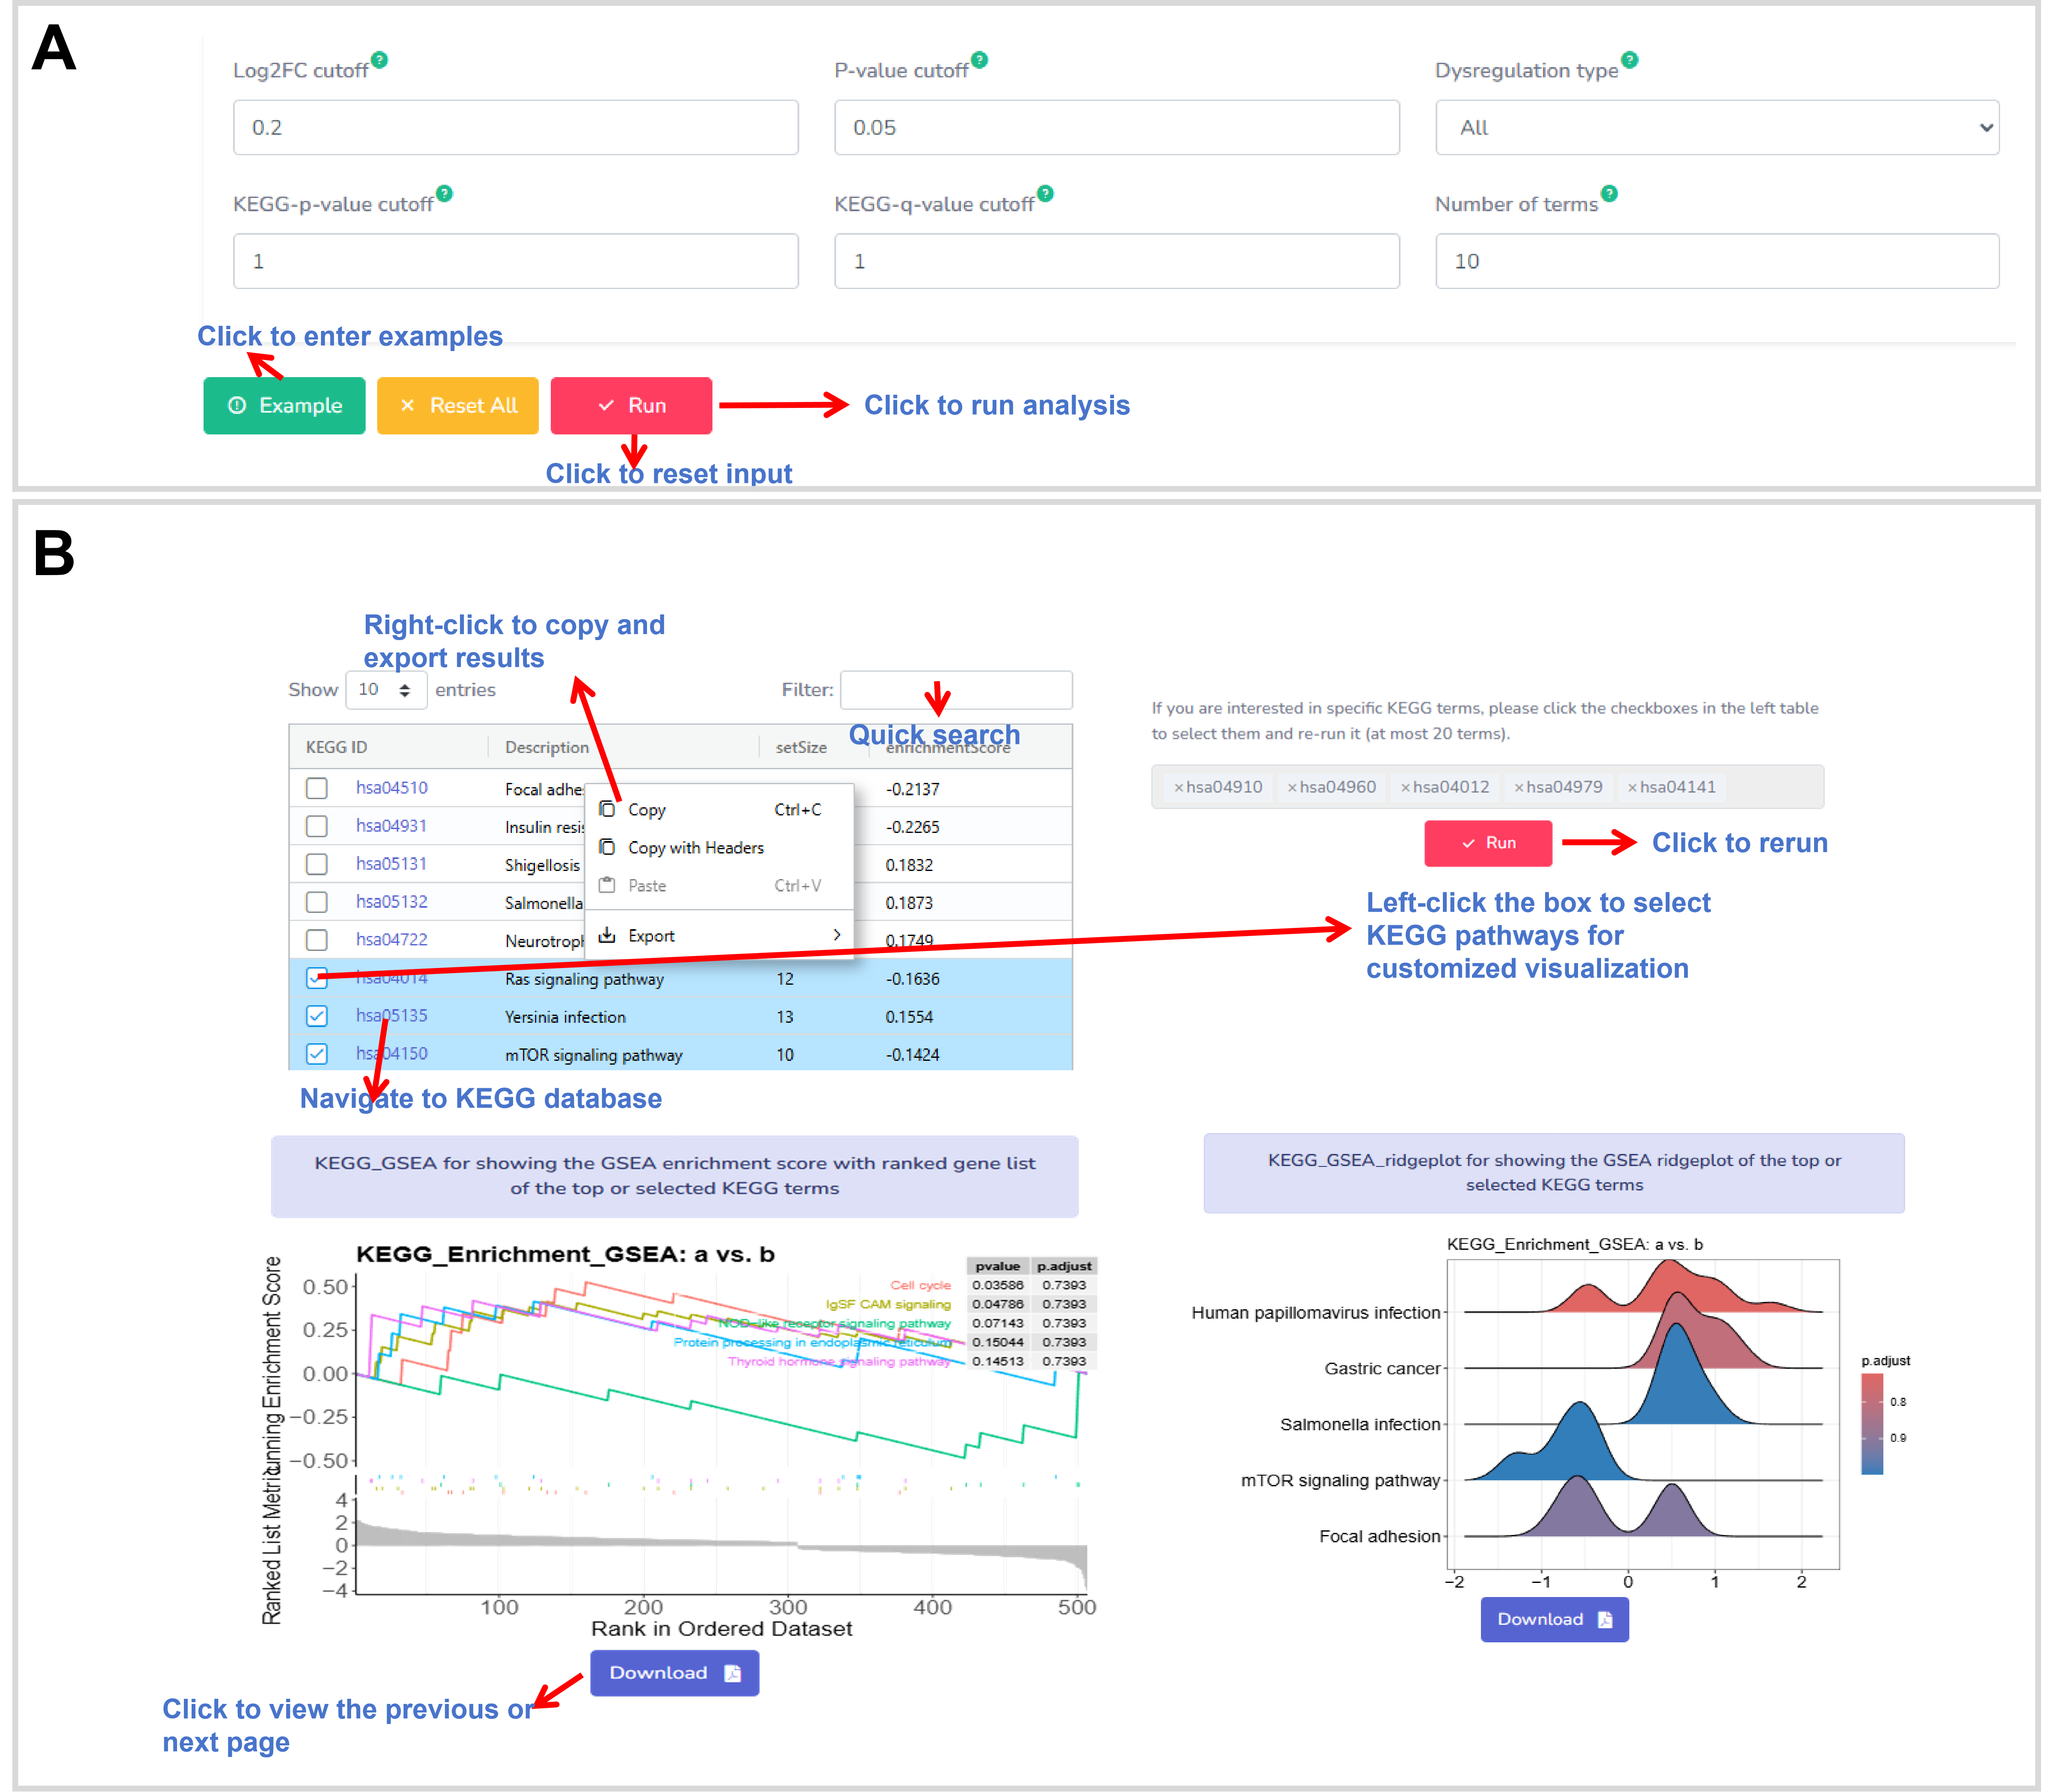
Figure 16. The web interface of the KEGG GSEA.
Description:
The GO TreePlot analysis function aims to perform the Gene Ontology (GO) enrichment
analysis on the significant differential circRNAs based on the annotations of their
host genes in the GO resource. The results are displayed as a table and tree plot.
The tree plot can be freely download and saved as a PDF file with high resolution
(Figure 17). A menu at the table header can be used to set columns and rows to show
the interesting information. The filter box allows to quick search. In addition,
right clicking on the table body displays an instruction form to copy and export the
table. Moreover, the GO ID links to the GO resource for the detail information of
the GO term.
R package(s): The dplyr, jsonlite, stringr, limma, ggplot2,
clusterProfiler, orgDbs, topGO, and Rgraphviz packages are used for the GO
enrichment analysis, involving in the data processes, differential expression
analysis and visualization.
Parameter(s): Log2FC cutoff:a threshold value of log2FC (two-folds change) to define the significant differential circRNA;p-value cutoff:a threshold p-value to define the significant differential circRNA;Dysregulation type:including All (all dysregulation gene feature ), Up (up-regulation gene feature), and Down (down-regulation gene feature);GO-p-value:a threshold p-value for the enriched GO term;GO-q-value:a threshold q-value for the enriched GO term.Number of terms:a number of the GO terms to show.
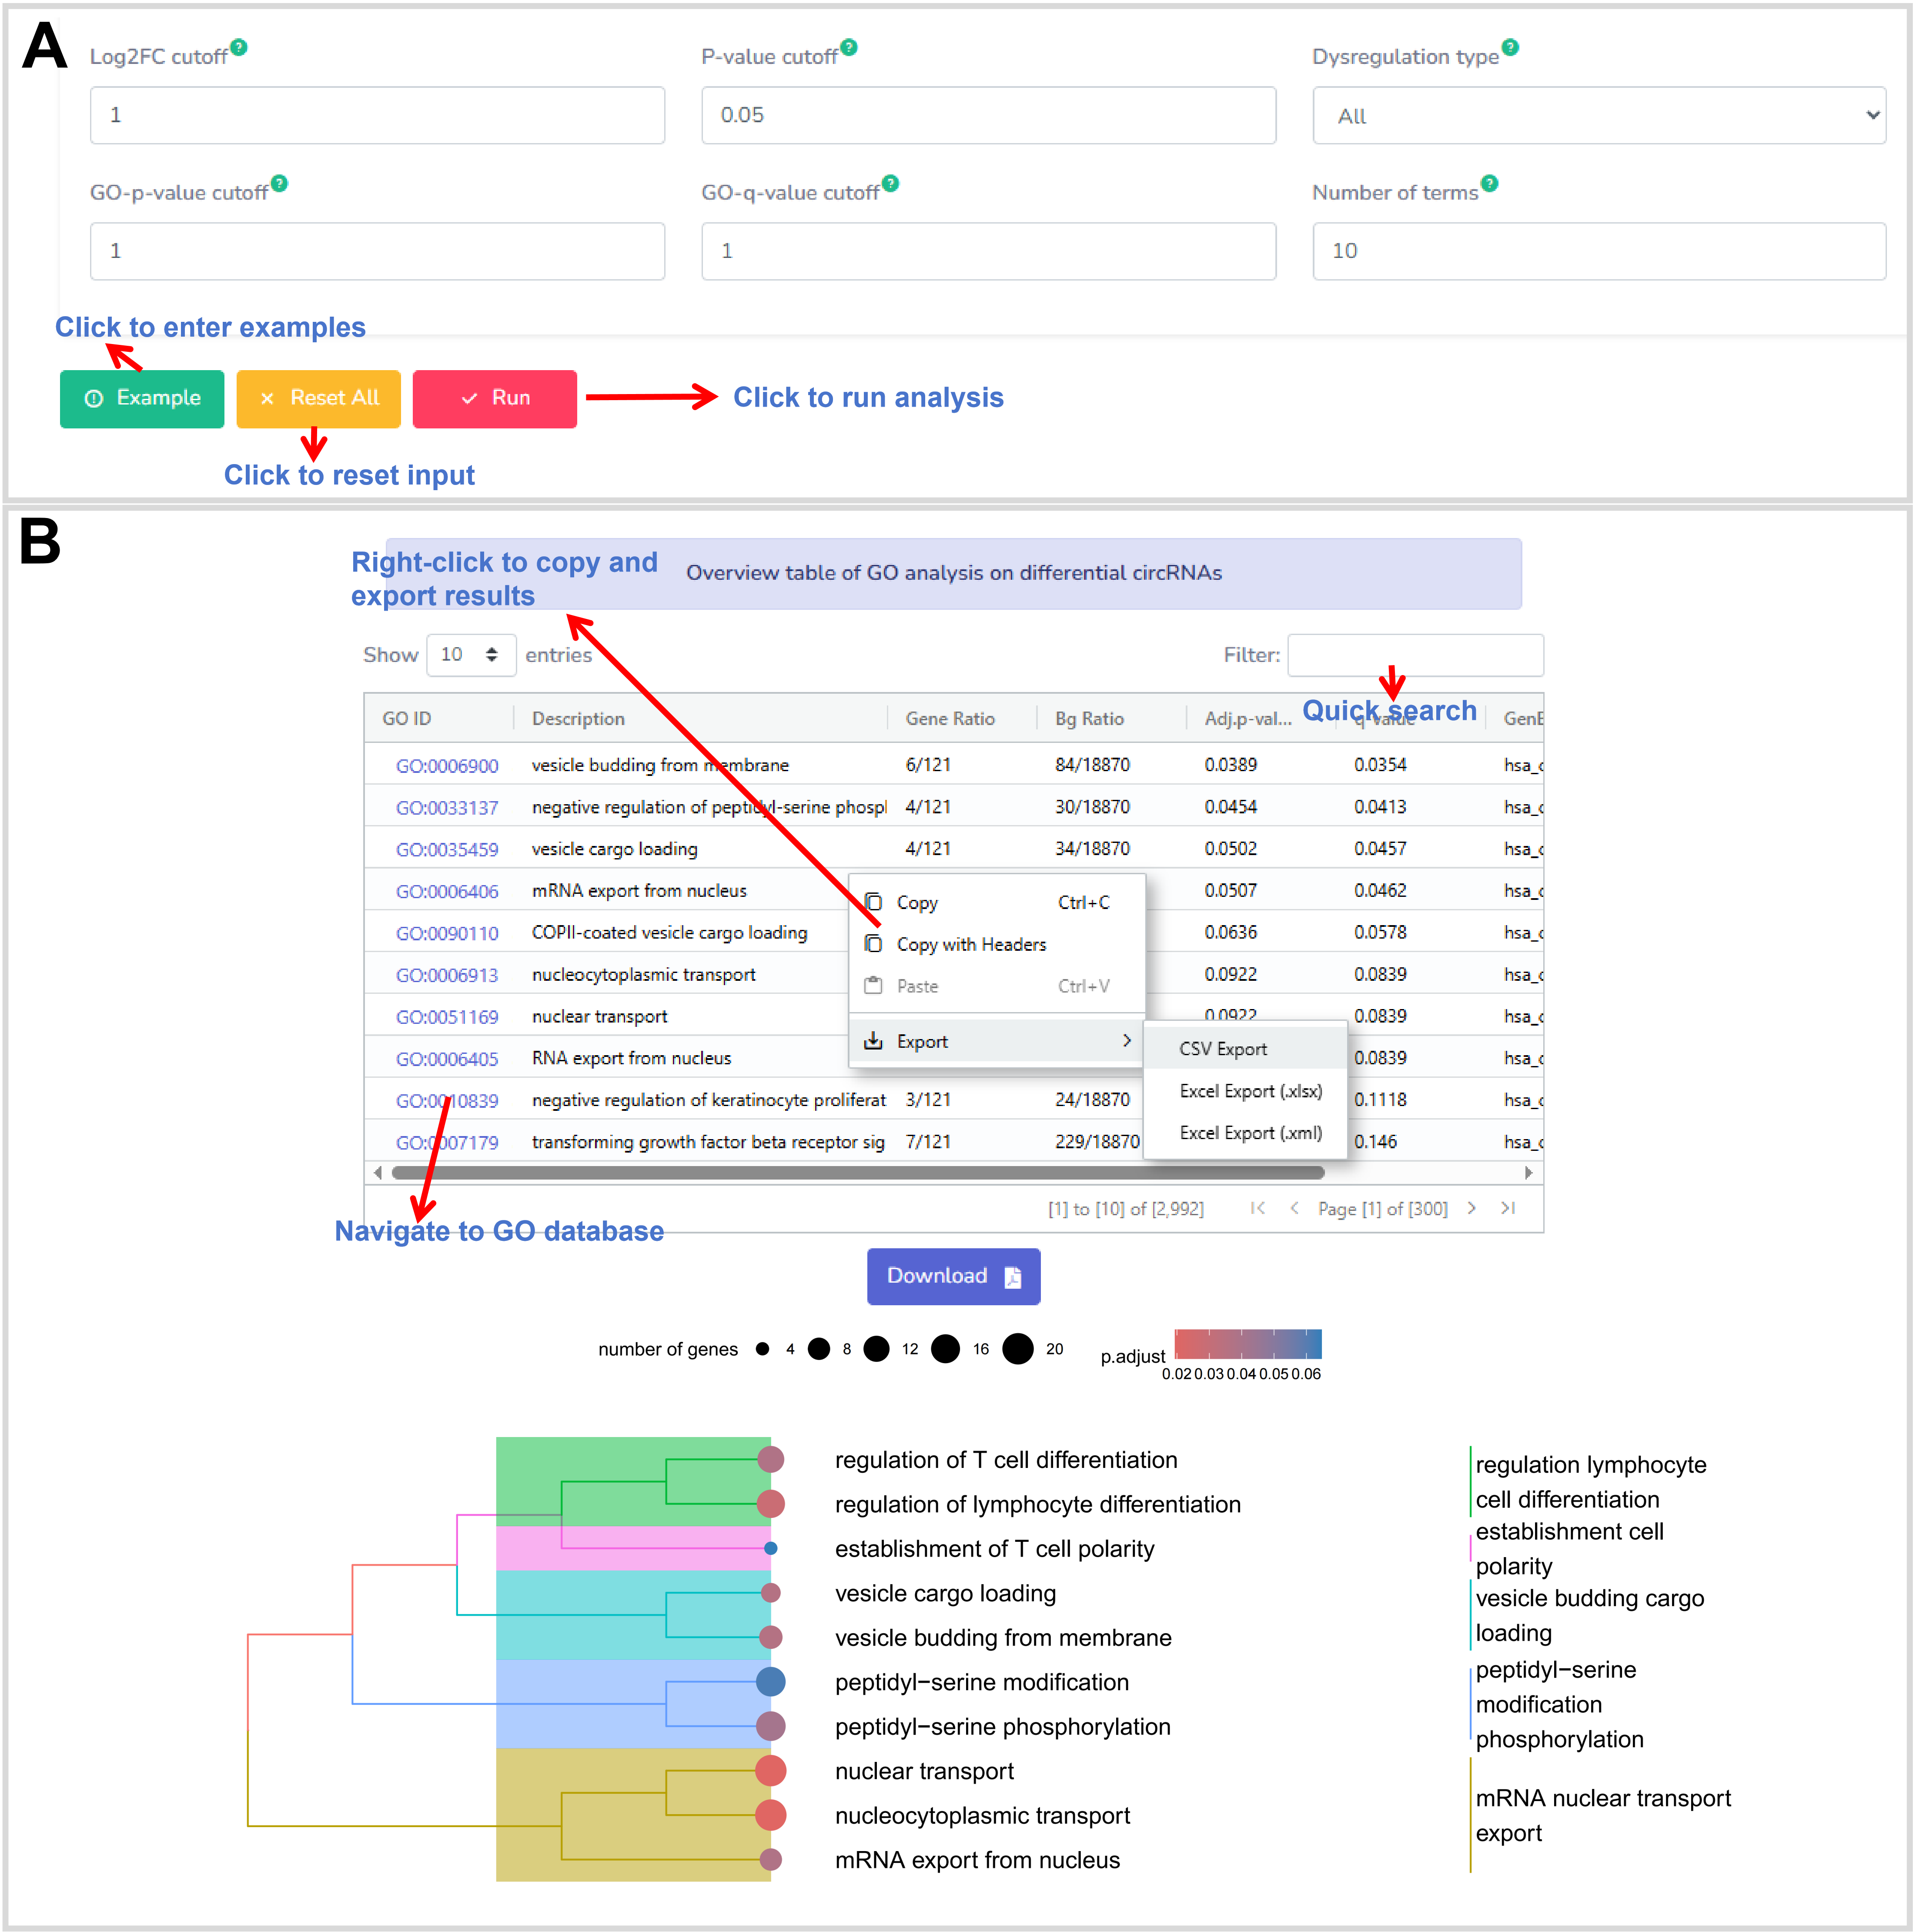
Figure 17. The web interface of the GO Treeplot.
5. Co-expression module
Co-expression module allows to select samples with specific physiological and pathological
condition to further perform various co-expression analyses on the circRNA transcriptomic
data set (Figure 18). Currently, the co-expression module
offers eight analyses, including
Co-expression,
Linear graph,
Boxplot,
Corrplot,
CircosPlot,
NetworkPlot,
GO enrichment, and
KEGG enrichment (Figure 18).
All of the results from these analyses are displayed as a graph or table. The graph results
can be freely downloaded and saved as a PDF file with high resolution, while the table
results provide a filter box that allows to quick search and a menu at the table header to
fit columns and rows to show and filter data. In addition, right click on the table body
will displays an instruction form to copy and export the table results for further analyses.
We have detailed these applications underneath.
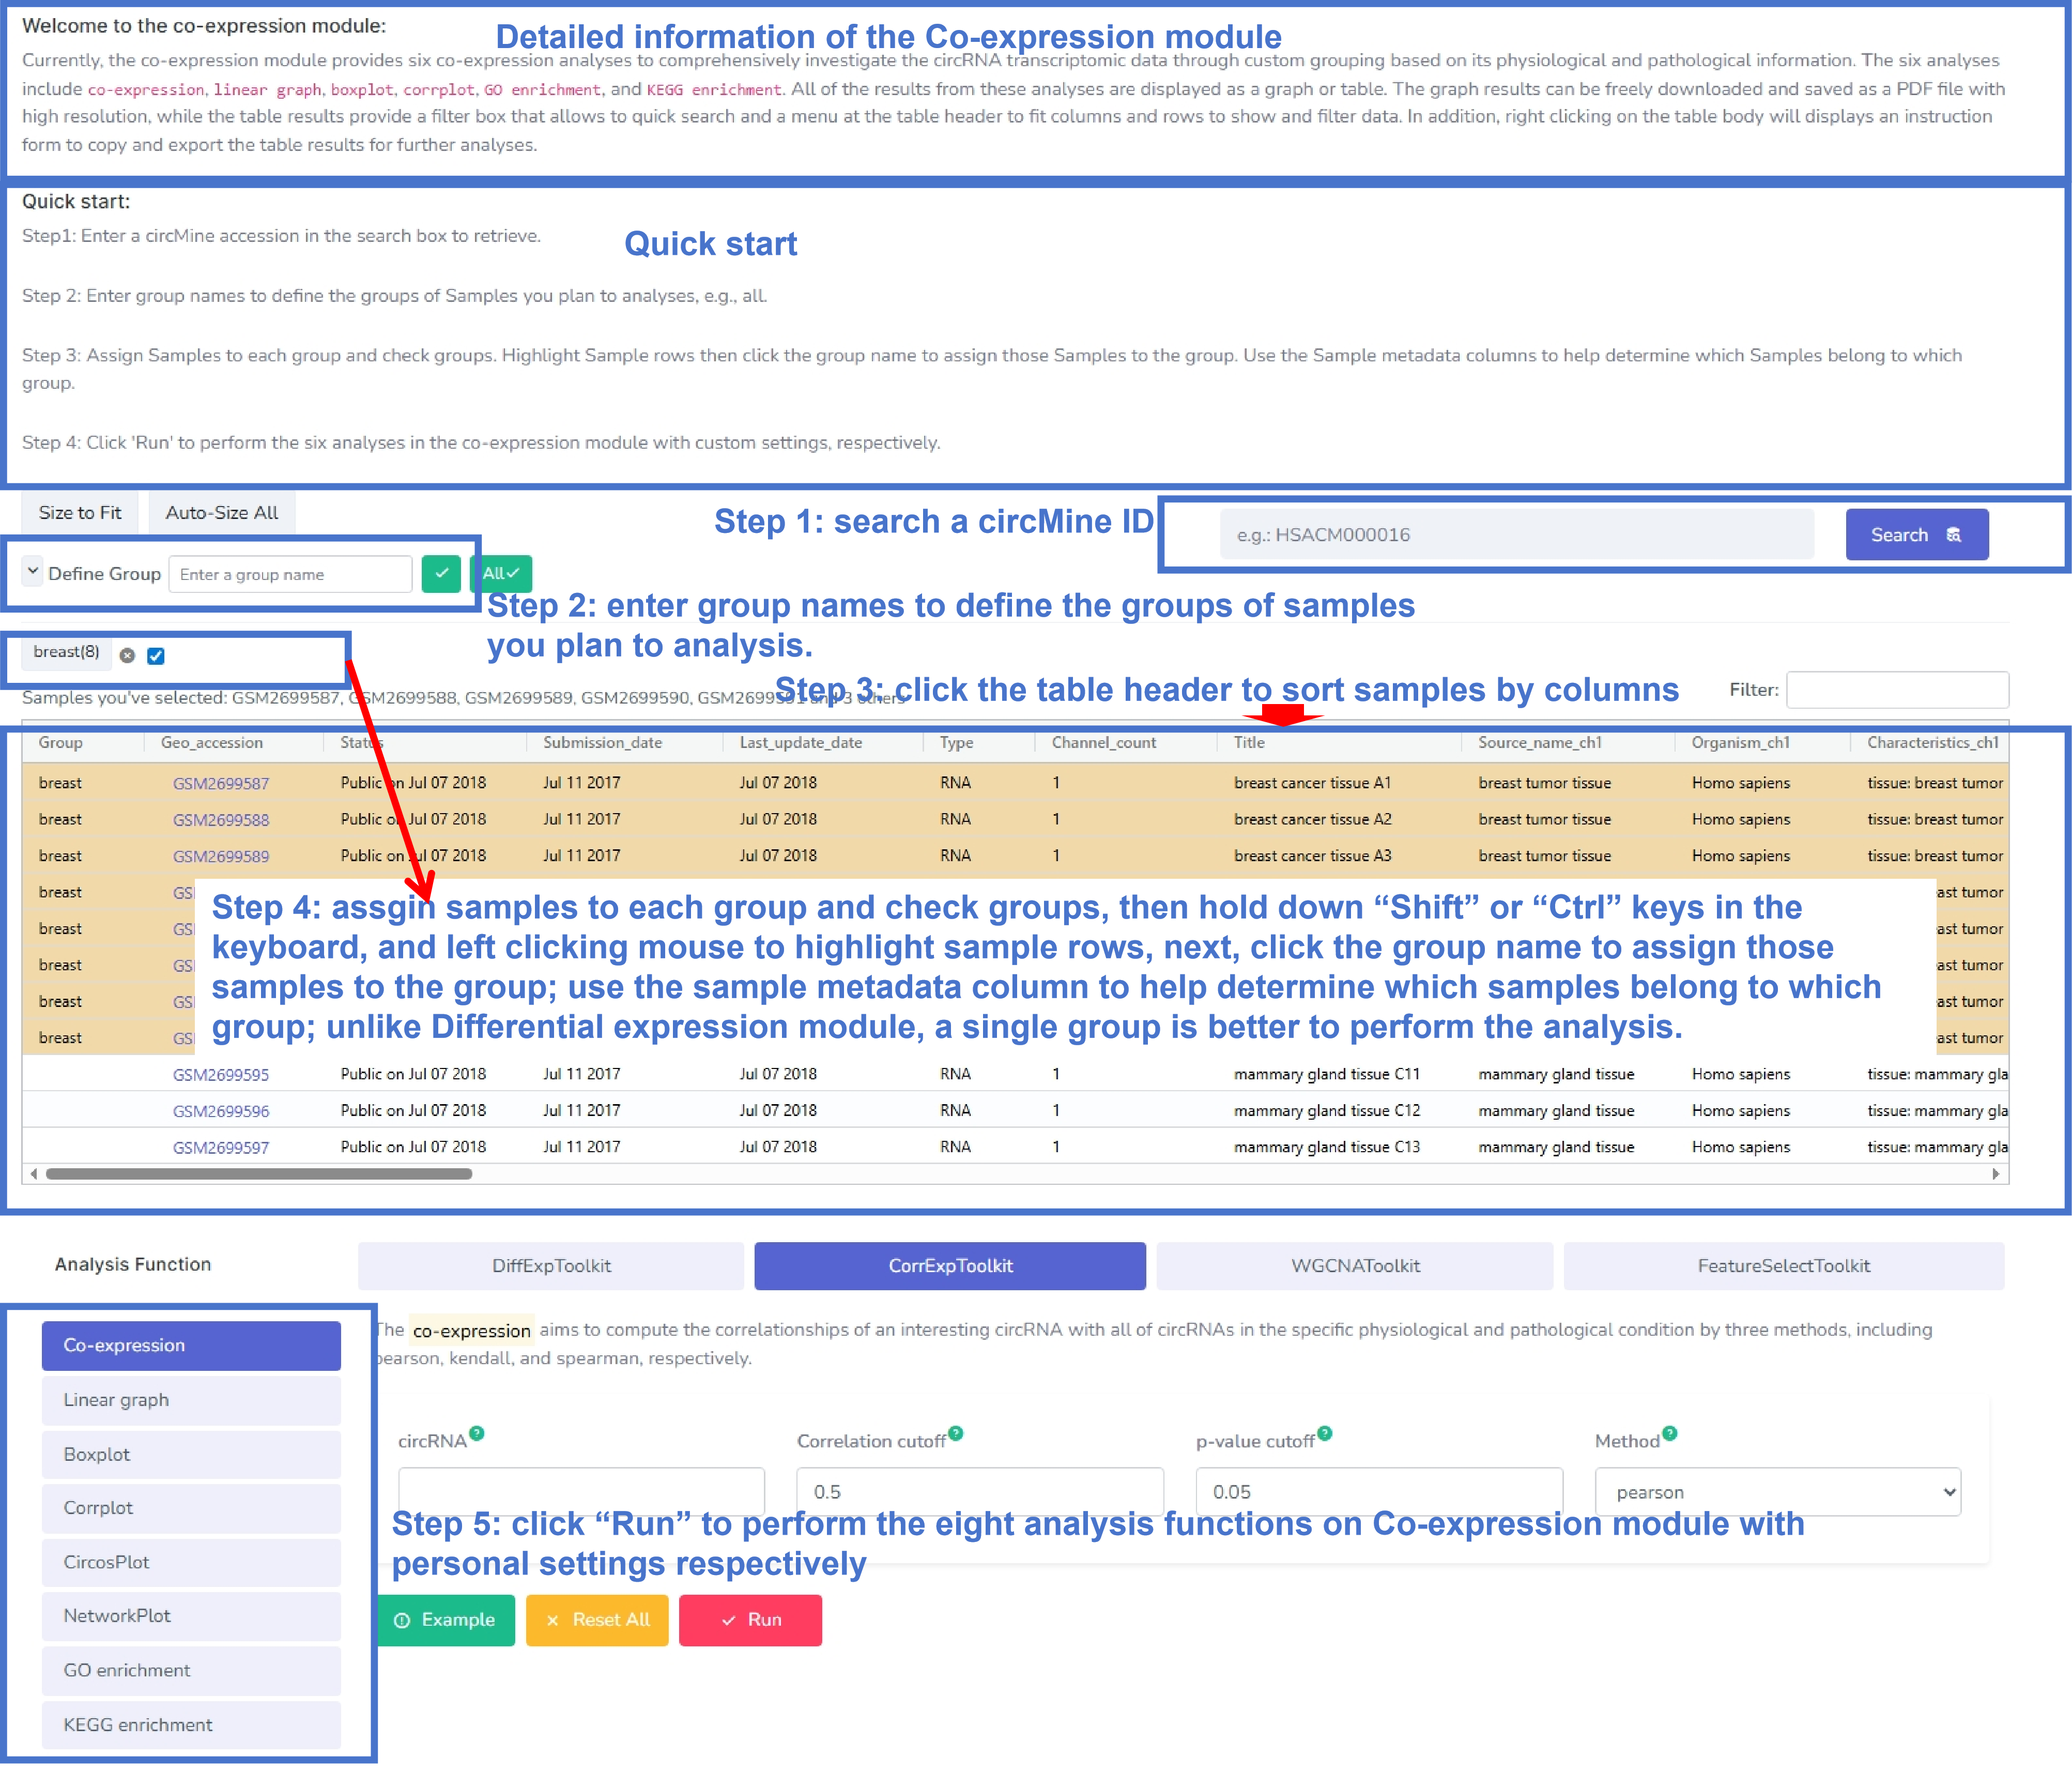
Figure 18.The web interface of the Co-expression module.
Description: The Co-expression analysis aims to compute the
correlationships of an interesting circRNA with all of circRNAs in the specific
physiological and pathological condition by three methods, including pearson,
kendall, and spearman, respectively. The Co-expression analysis results are
displayed in a table (Figure 19). A menu at the table header can be used to set
columns and rows to show interesting information (Figure 19). The filter box allows
to quick search. In addition, right clicking on the table body displays an
instruction form to copy and export the table. Moreover, the circBase ID links to
the circBase resource for the detail information of the circRNA.
R package(s): The dplyr and jsonlite packages are used
for the data processes.
The local cor.test function is used for the correlation analysis.
Parameter(s):circRNA:a circBase ID;Correlation cutoff:a threshold value for the significant correlation;p-value cutoff:a threshold p-value for the significant correlation;Method:including pearson, kendall, and spearman.
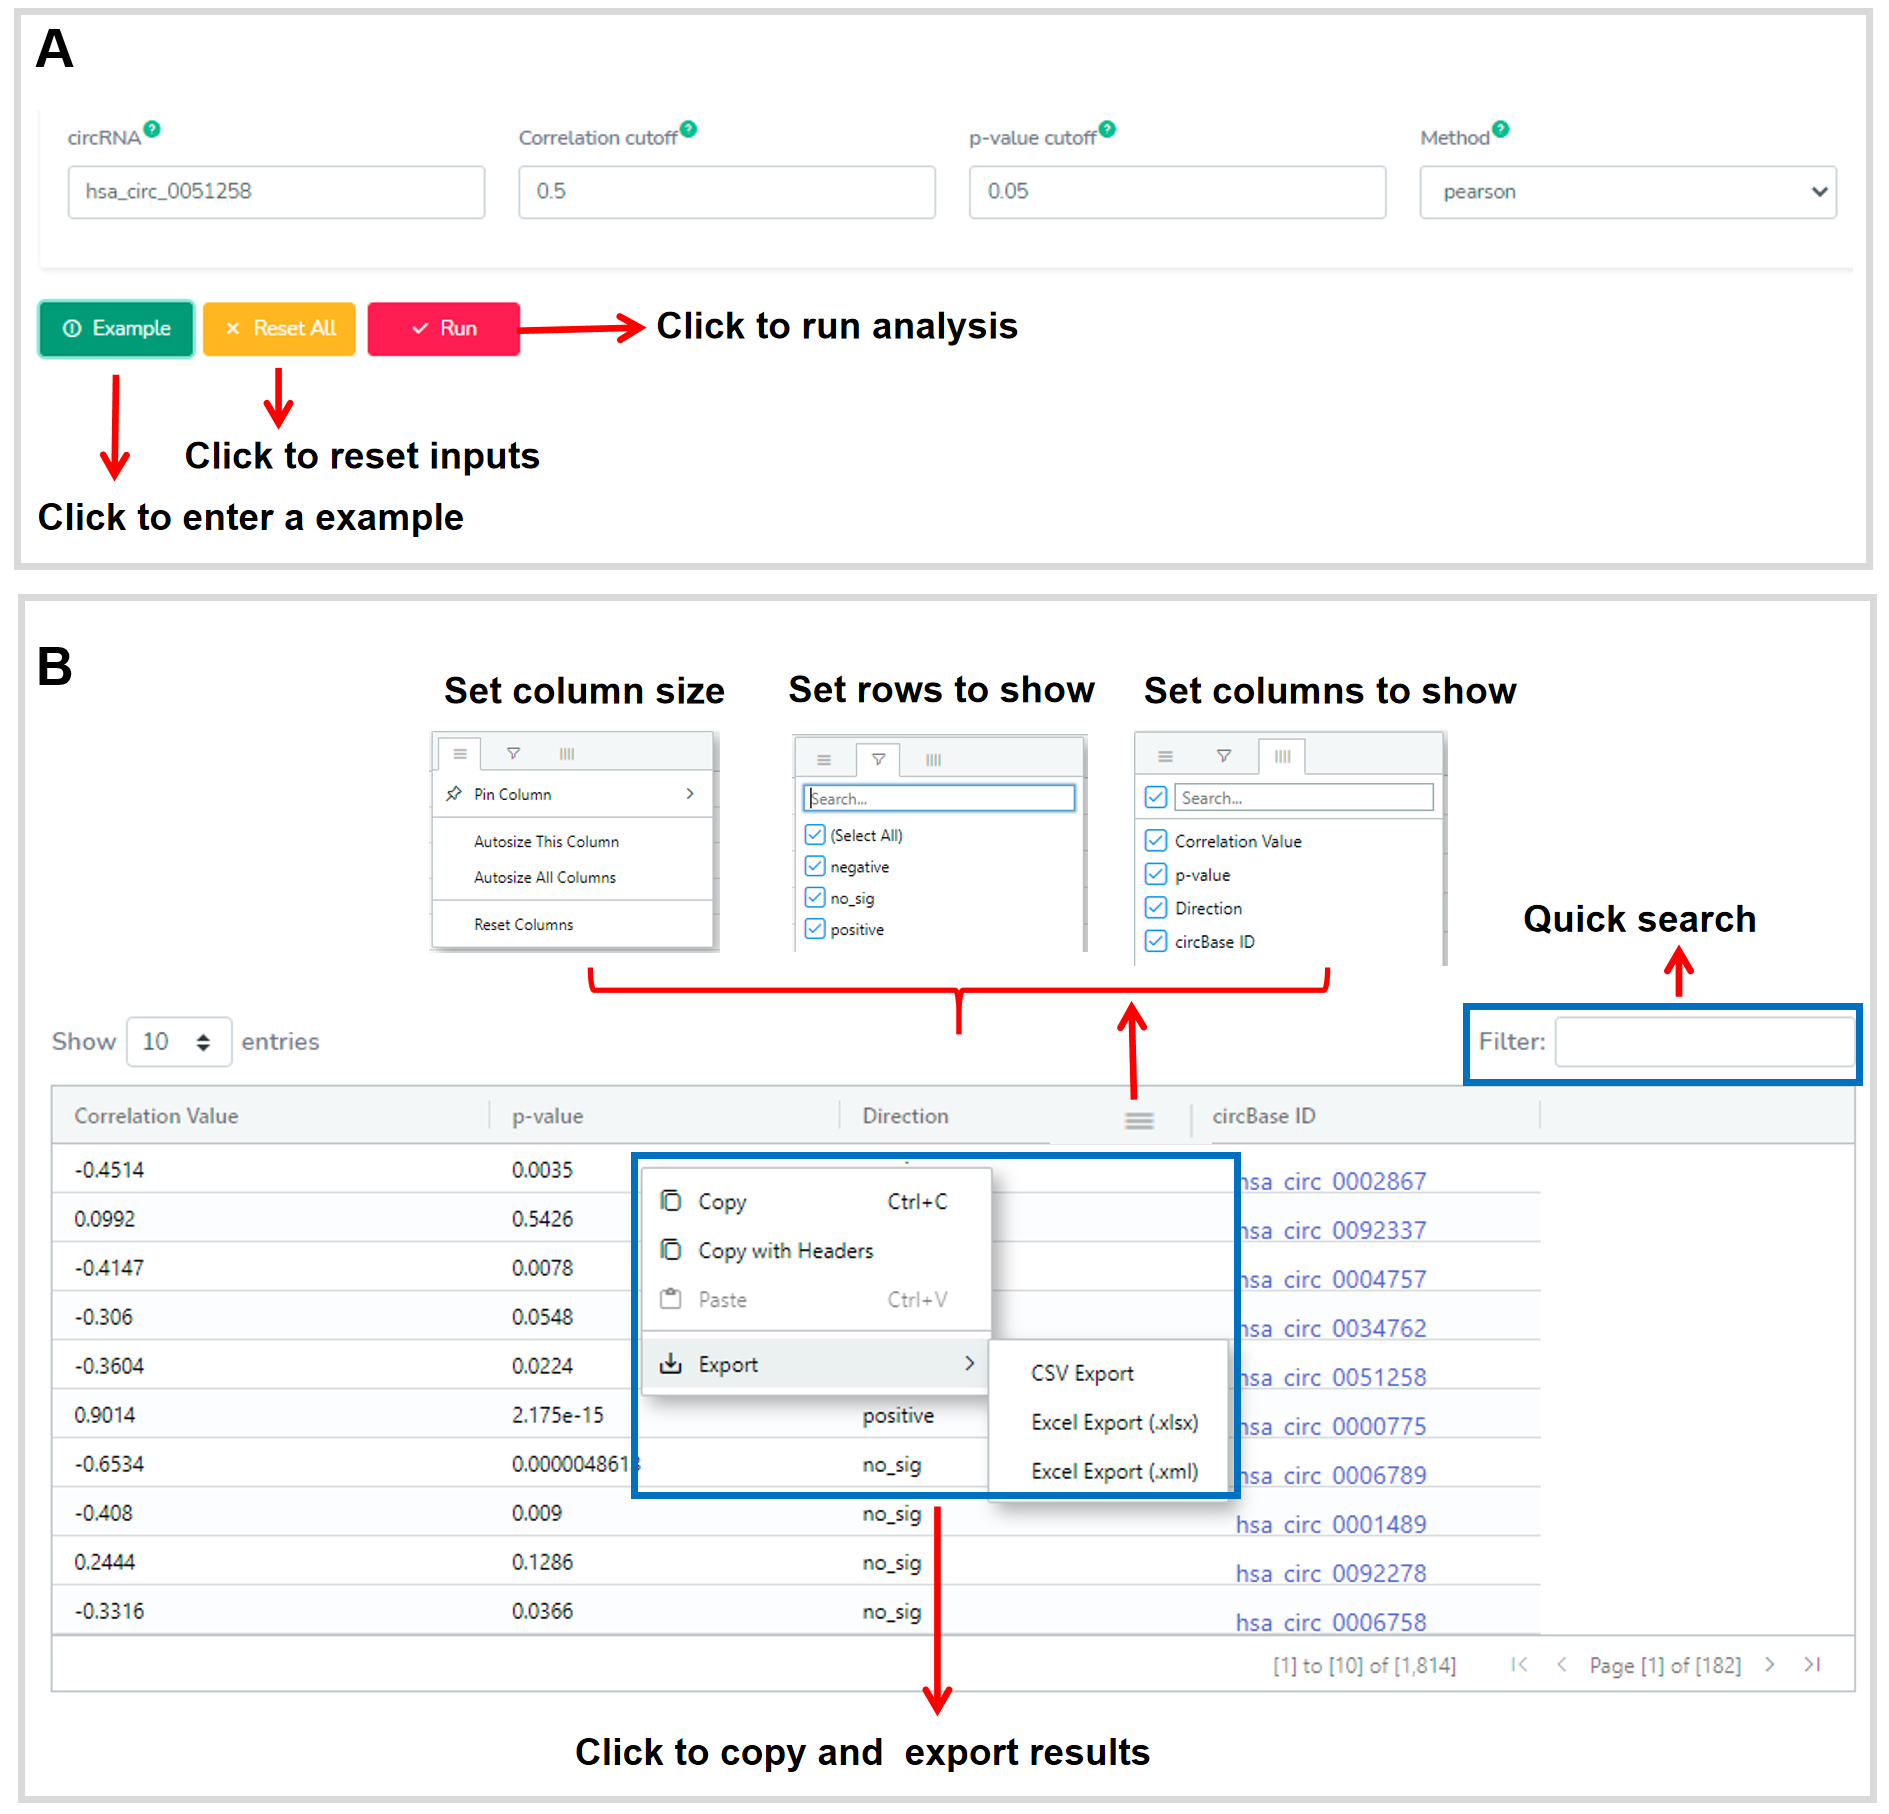
Figure 19. The web interface of the Co-expression.
Description: Linear graph in the Co-expression module is a helpful
application to perform correlation analysis of two circRNAs in the specific
physiological and pathological condition by three methods, including pearson,
kendall, and spearman. The result displays as a linear graph, which can be freely
download and saved as a PDF file with high resolution (Figure 20).
R package(s):The dplyr package is used for the data processes.
The ggscatter function in the ggpubr package is used
for the co-expression analysis of two circRNAs and drawing a linear graph.
Parameter(s):circRNA1:a circBase ID;circRNA2:a circBase ID;Method:including pearson, kendall, and spearman;
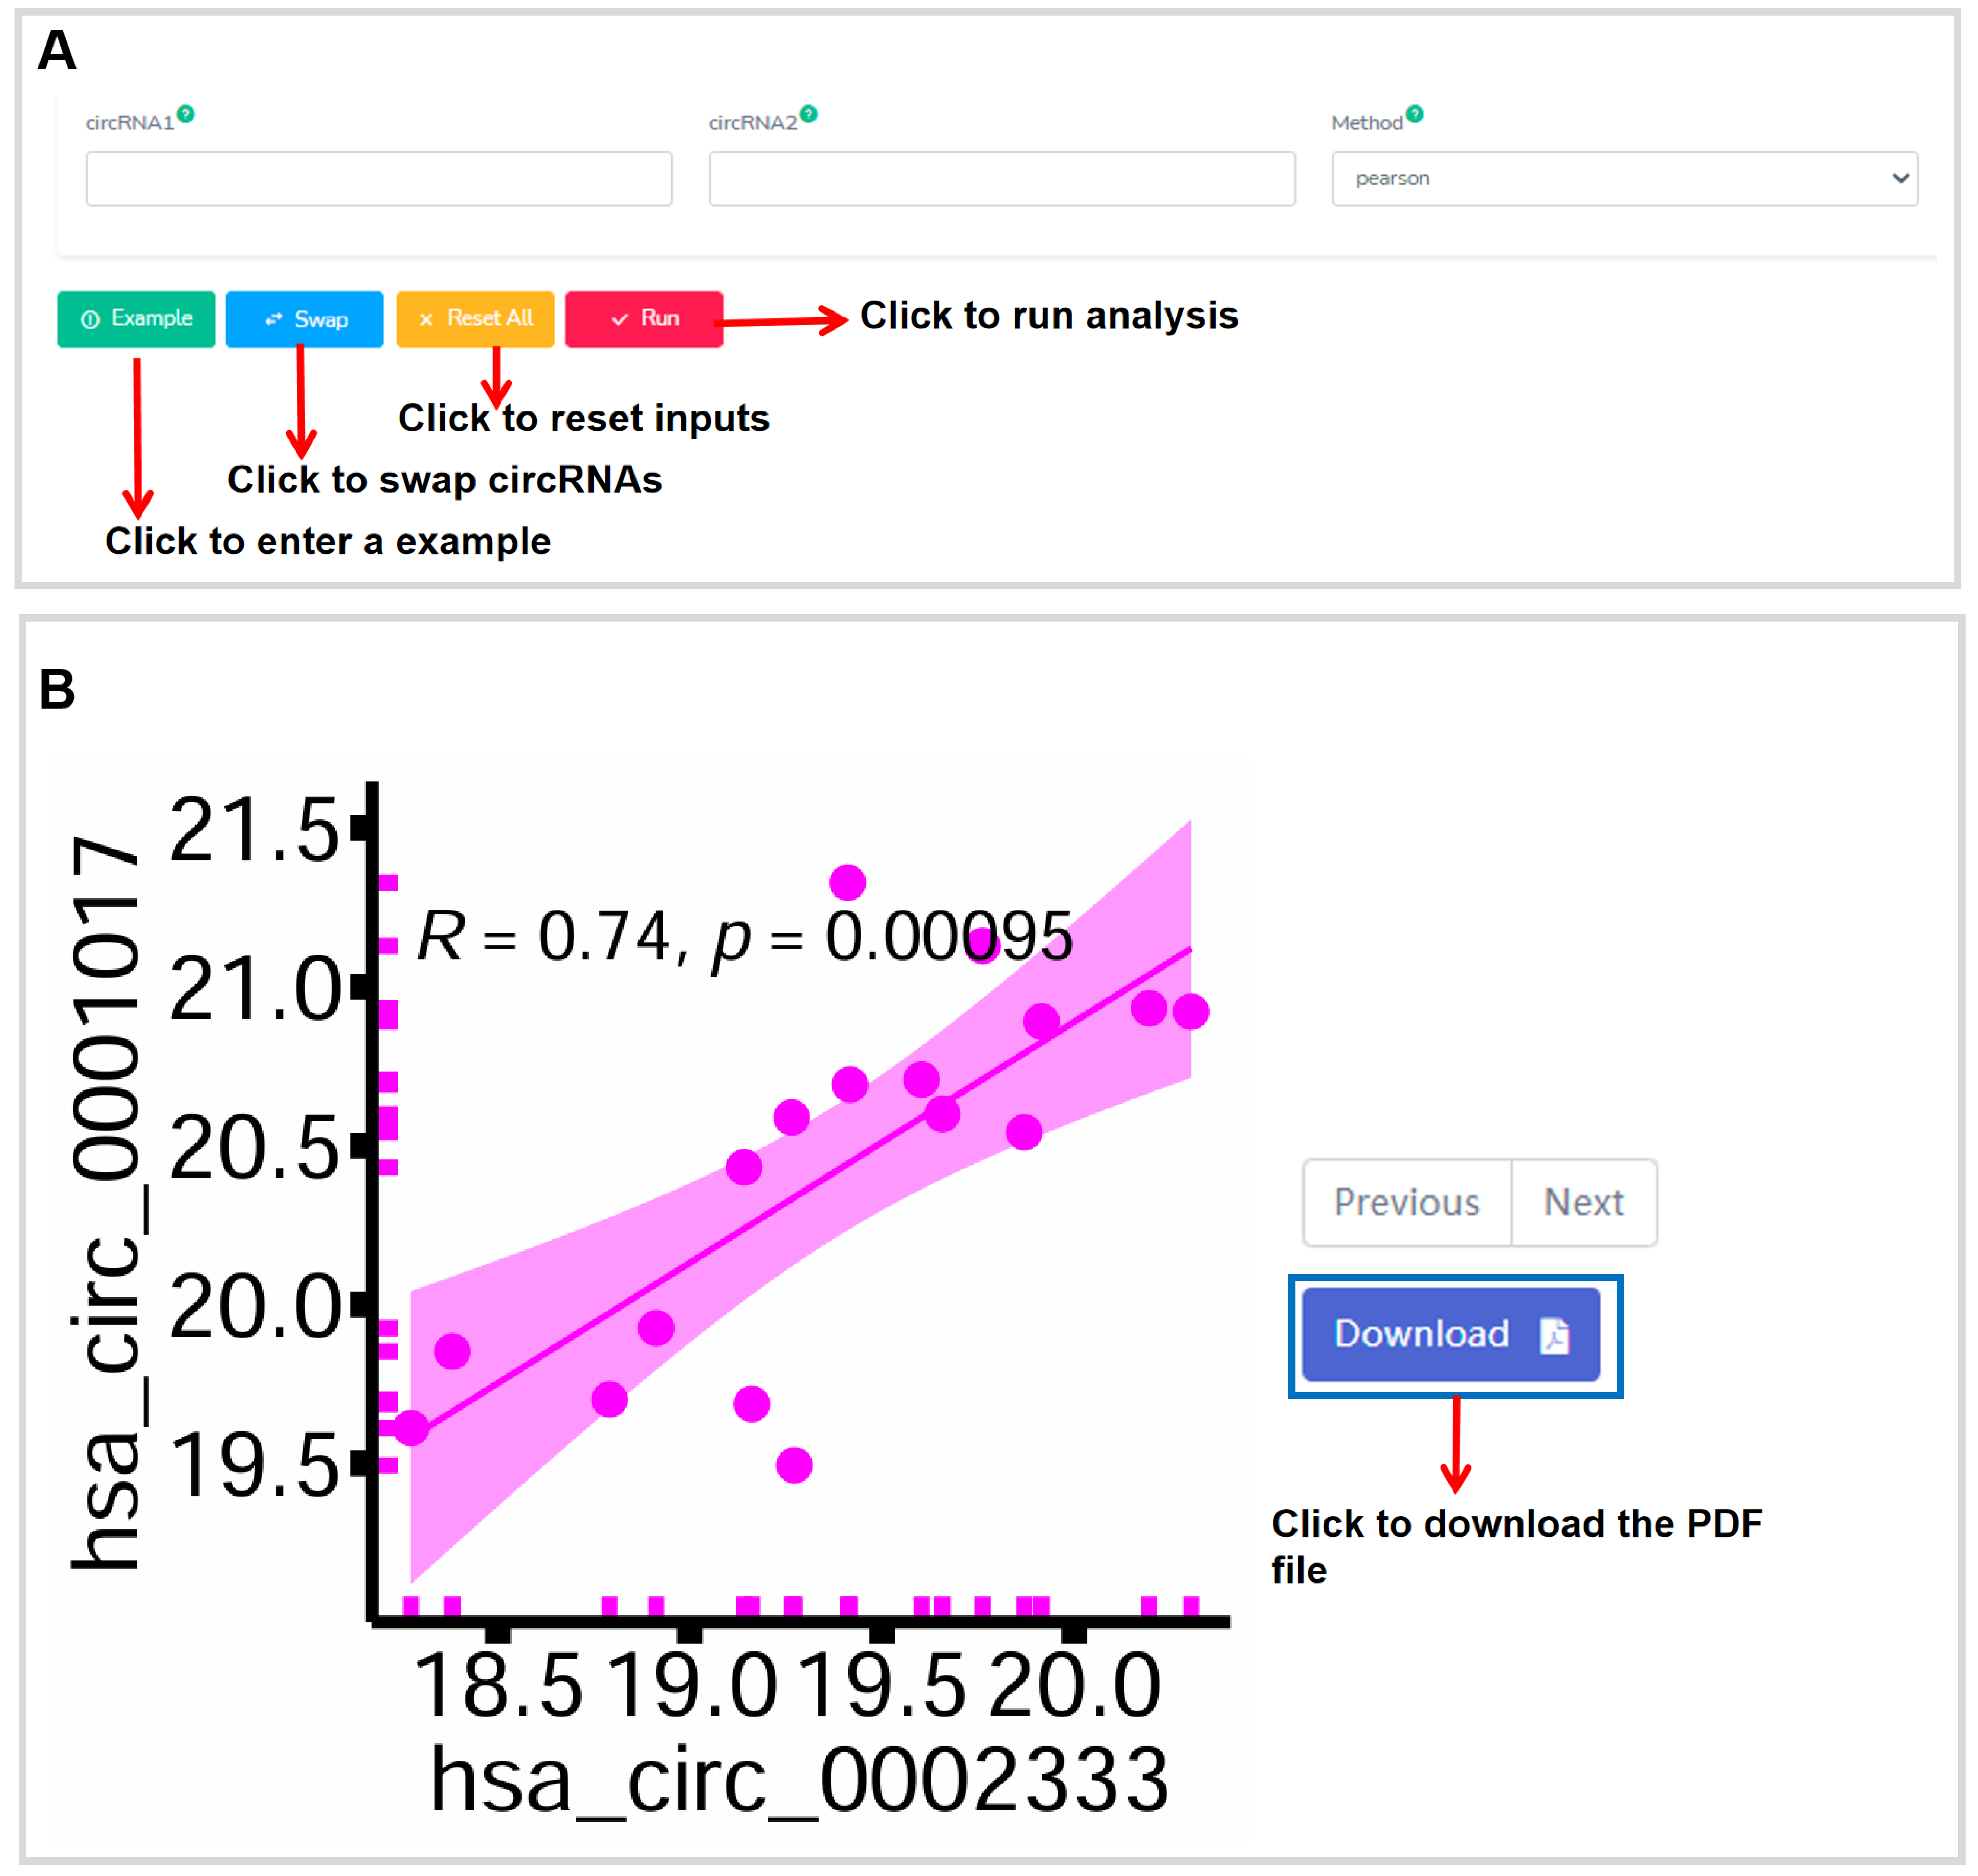
Figure 20. The web interface of the Linear graph.
Description:
Boxplot in the Co-expression module is a helpful application to perform a paired
correlation analysis of two circRNAs in the specific physiological and pathological
condition by setting methods (including t.test and wilcox.test). The result displays
as a box plot, which can be freely download and saved as a PDF file with high
resolution (Figure 21).
R packages:The dplyr package is used for the data processes.
The ggscatter function in the ggpubr package is used
for the co-expression analysis of two circRNAs and drawing a box plot.
Parameter(s):circRNA1:a circBase ID;circRNA2:a circBase ID;Method:including t.test and wilcox.test;
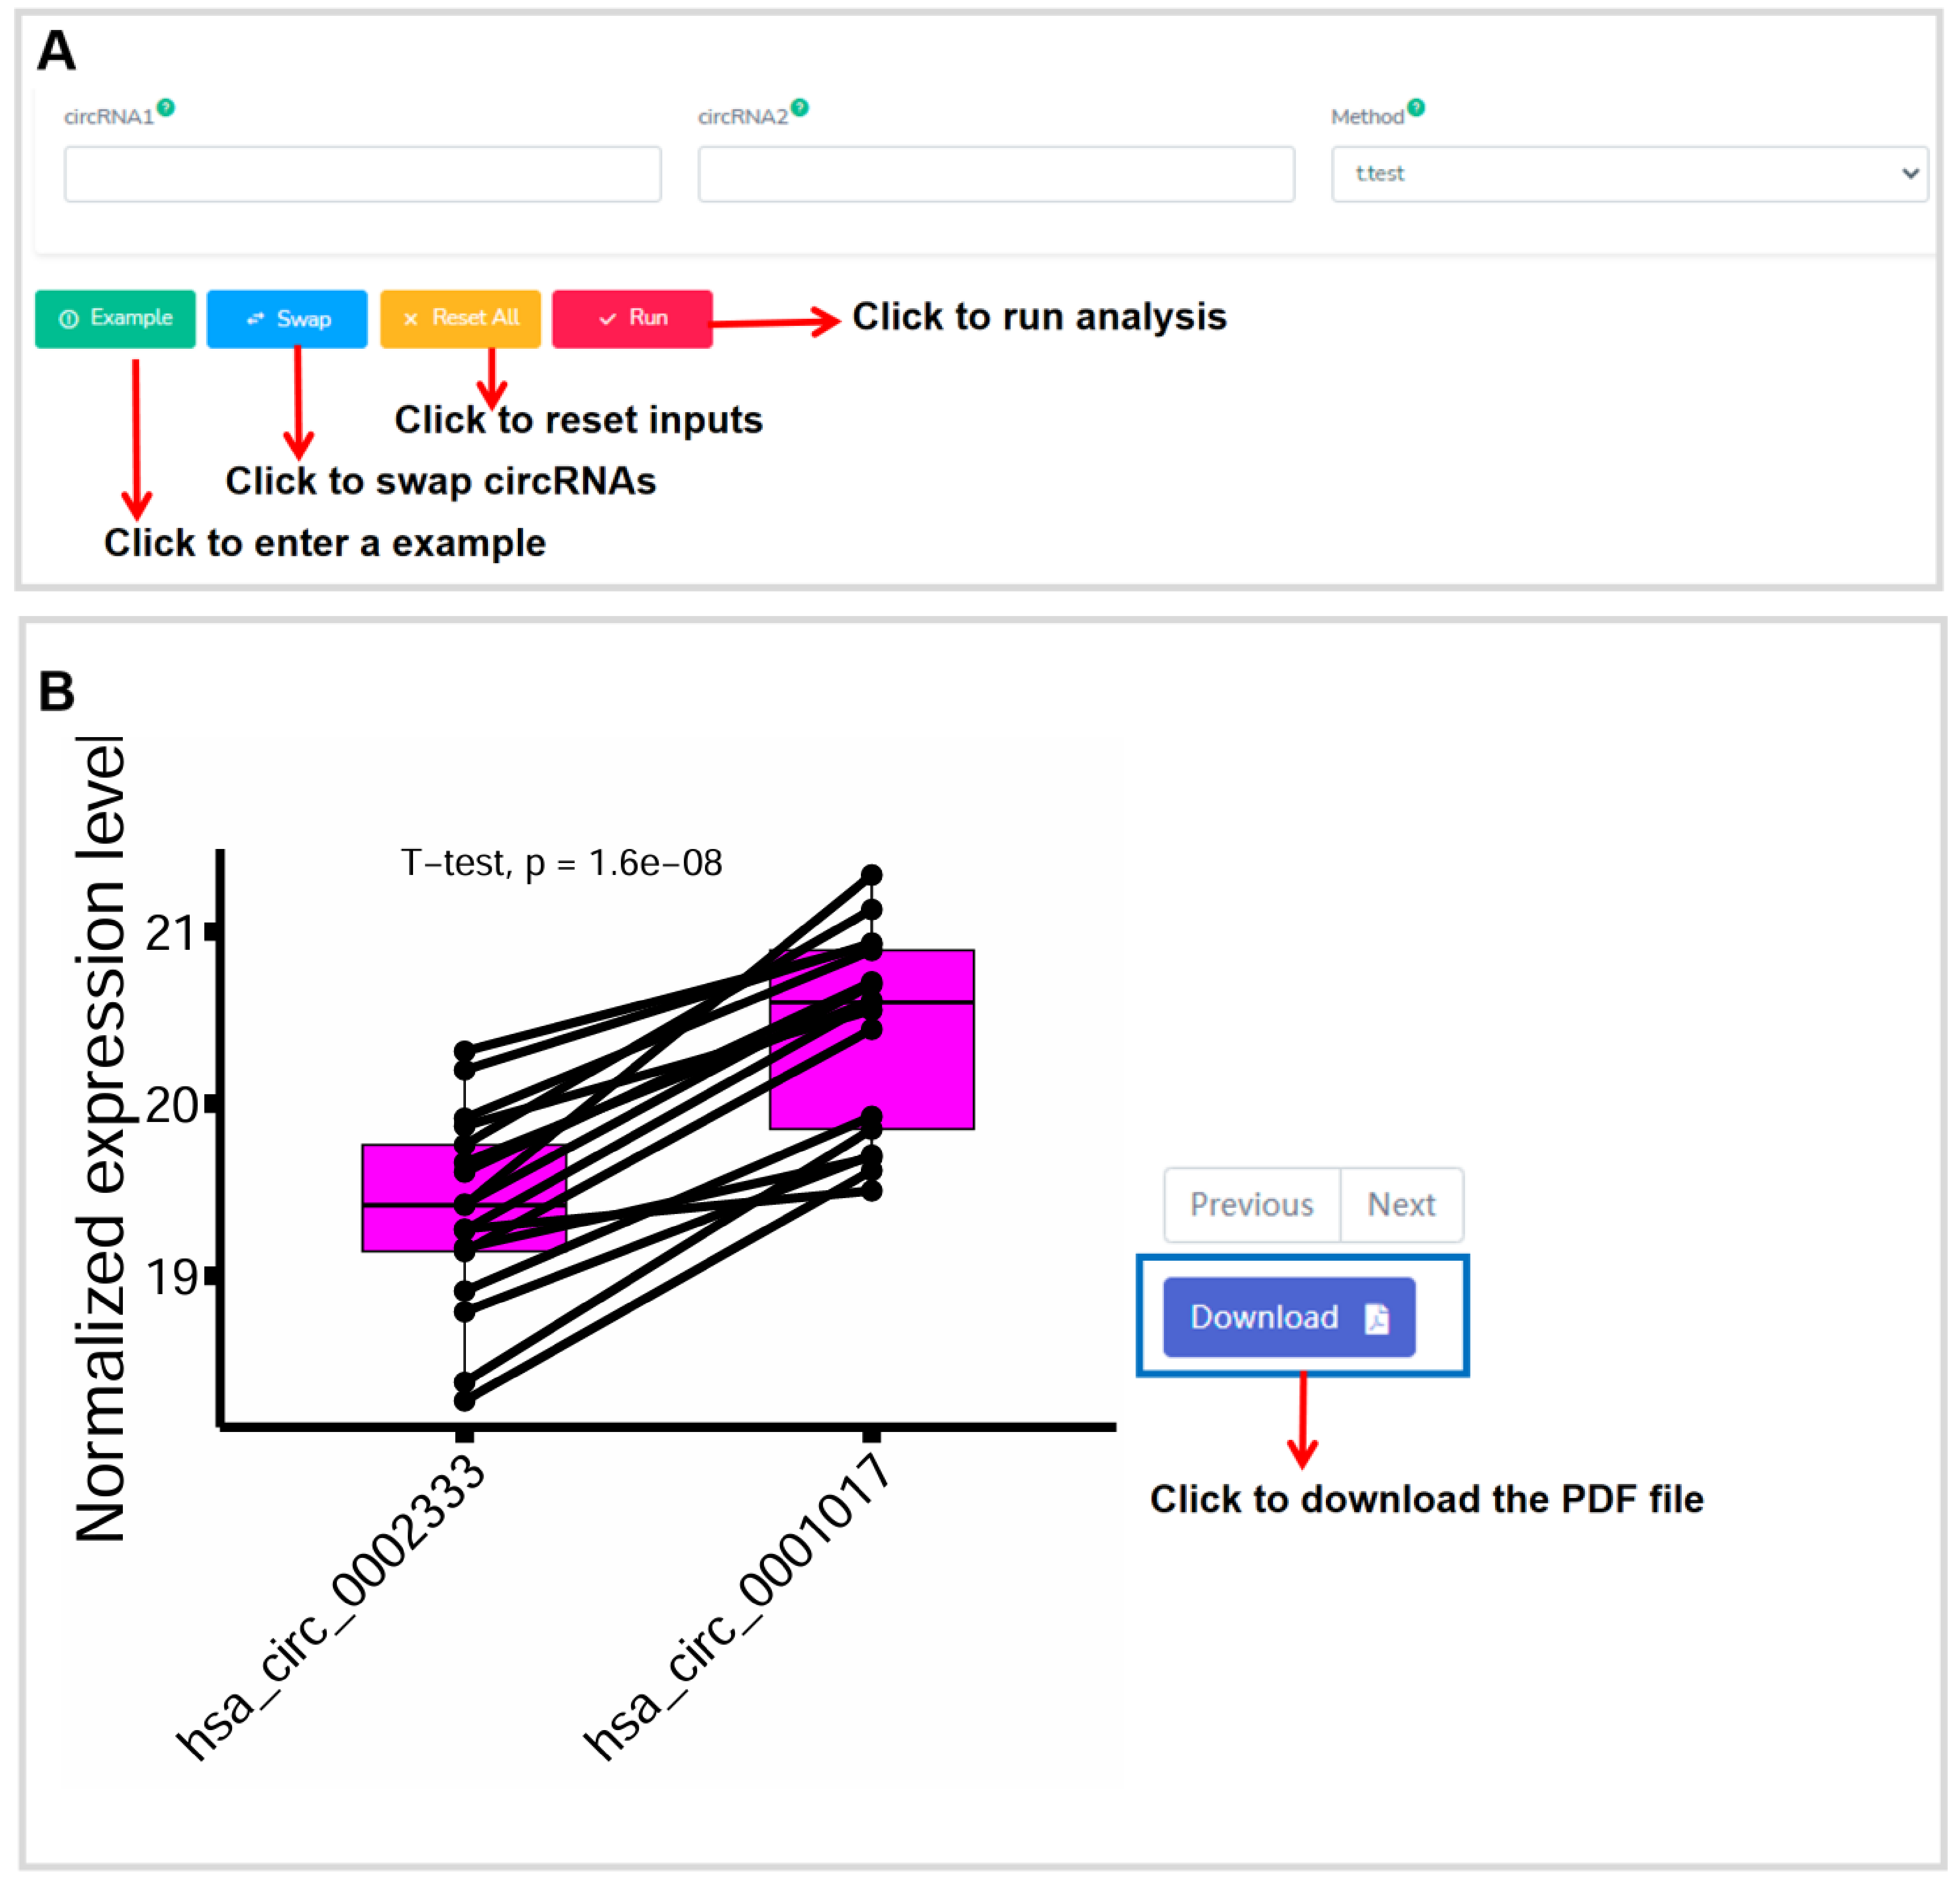
Figure 21. The web interface of the Boxplot in the Co-expression module.
Description:
Corrplot in the Co-expression module is a helpful application to depict the
correlationships among multiple circRNAs in the specific physiological and
pathological condition. The result displays as various visualizations by setting the
method parameter, which can be freely downloaded and saved as a PDF file with high
resolution (Figure 22). ( *: p<=0.05; **: p<=0.01; ***: p<=0.001)
R package(s): The dplyr package is used for the data processes.
The cor.test function is used for the co-expression analysis.
The ggplot2 and corrplot packages are used for the corrplot.
Parameter(s): circRNA(s):at least three circBase IDs;Method:including circle, square, ellipse, number, color, pie, and shade.
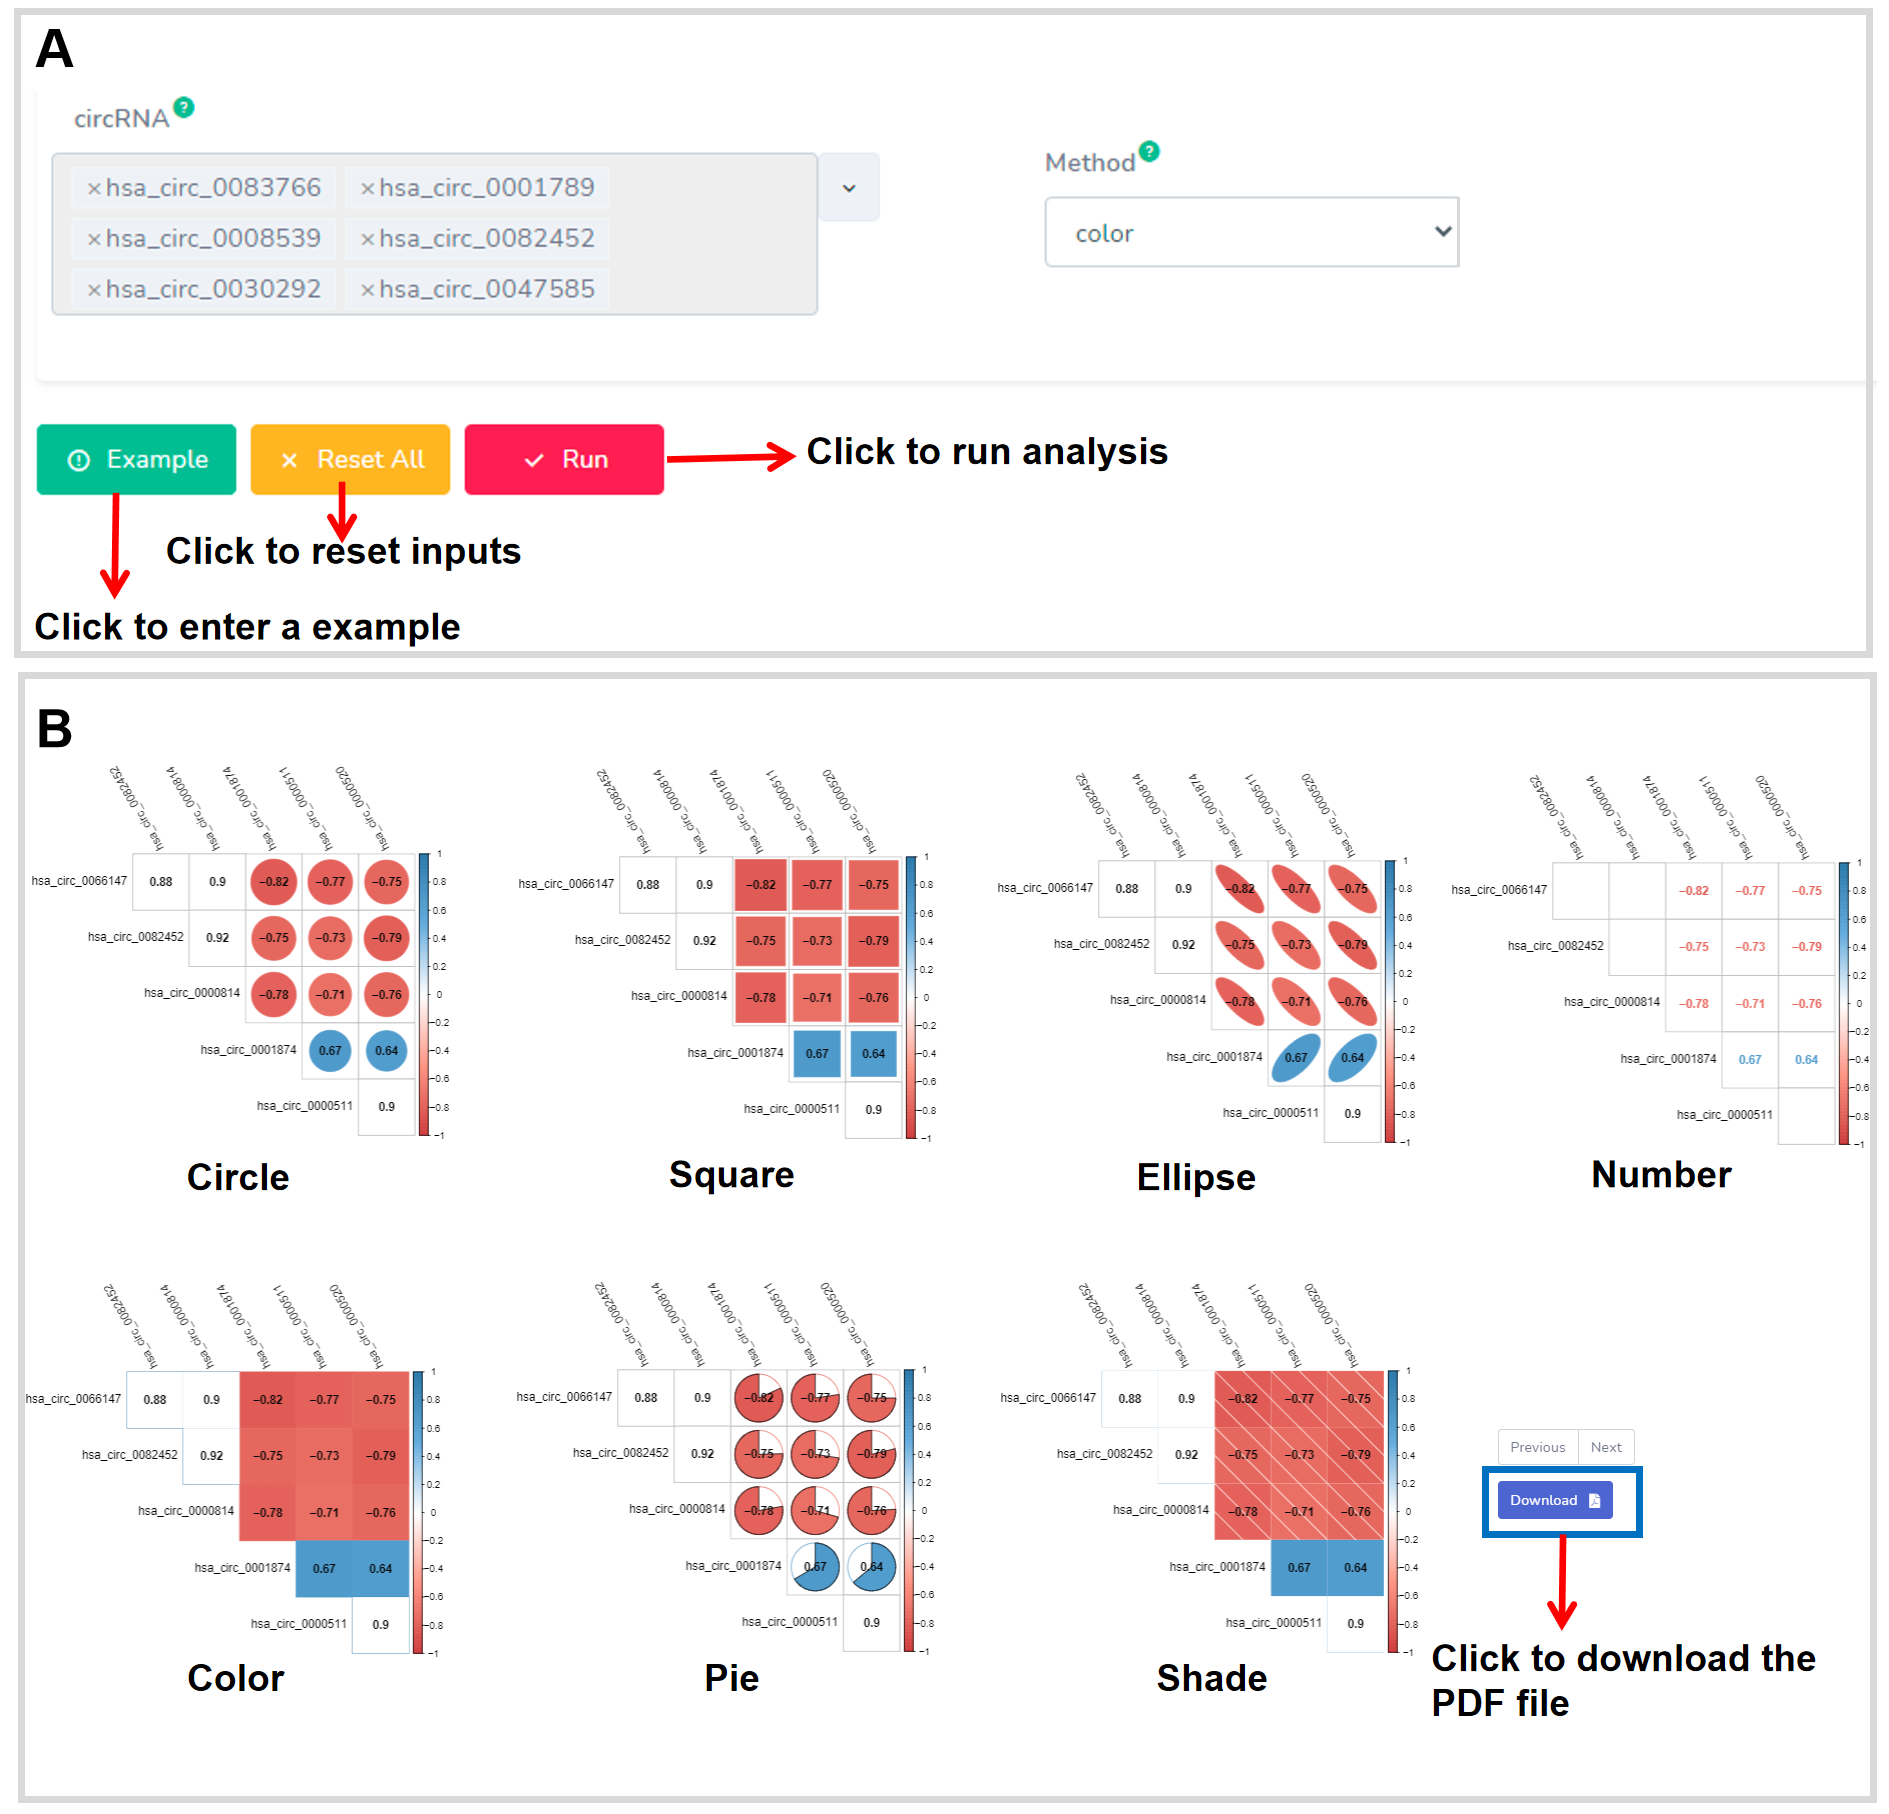
Figure 22. The web interface of the Corrplot.
Description:
CircosPlot in the co-expression module is a helpful application to depict the
correlationships among multiple circRNAs in the specific physiological and
pathological condition. The result displays as a circos plot, which can be freely
downloaded and saved as a PDF file with high resolution (Figure 23).
R package(s): CircosPlot in the Co-expression module is a helpful
application to depict the correlationships among multiple circRNAs in the specific
physiological and pathological condition.
Parameter(s): circRNA(s):at least three circBase IDs;Method:including pearson, kendall, and spearman.
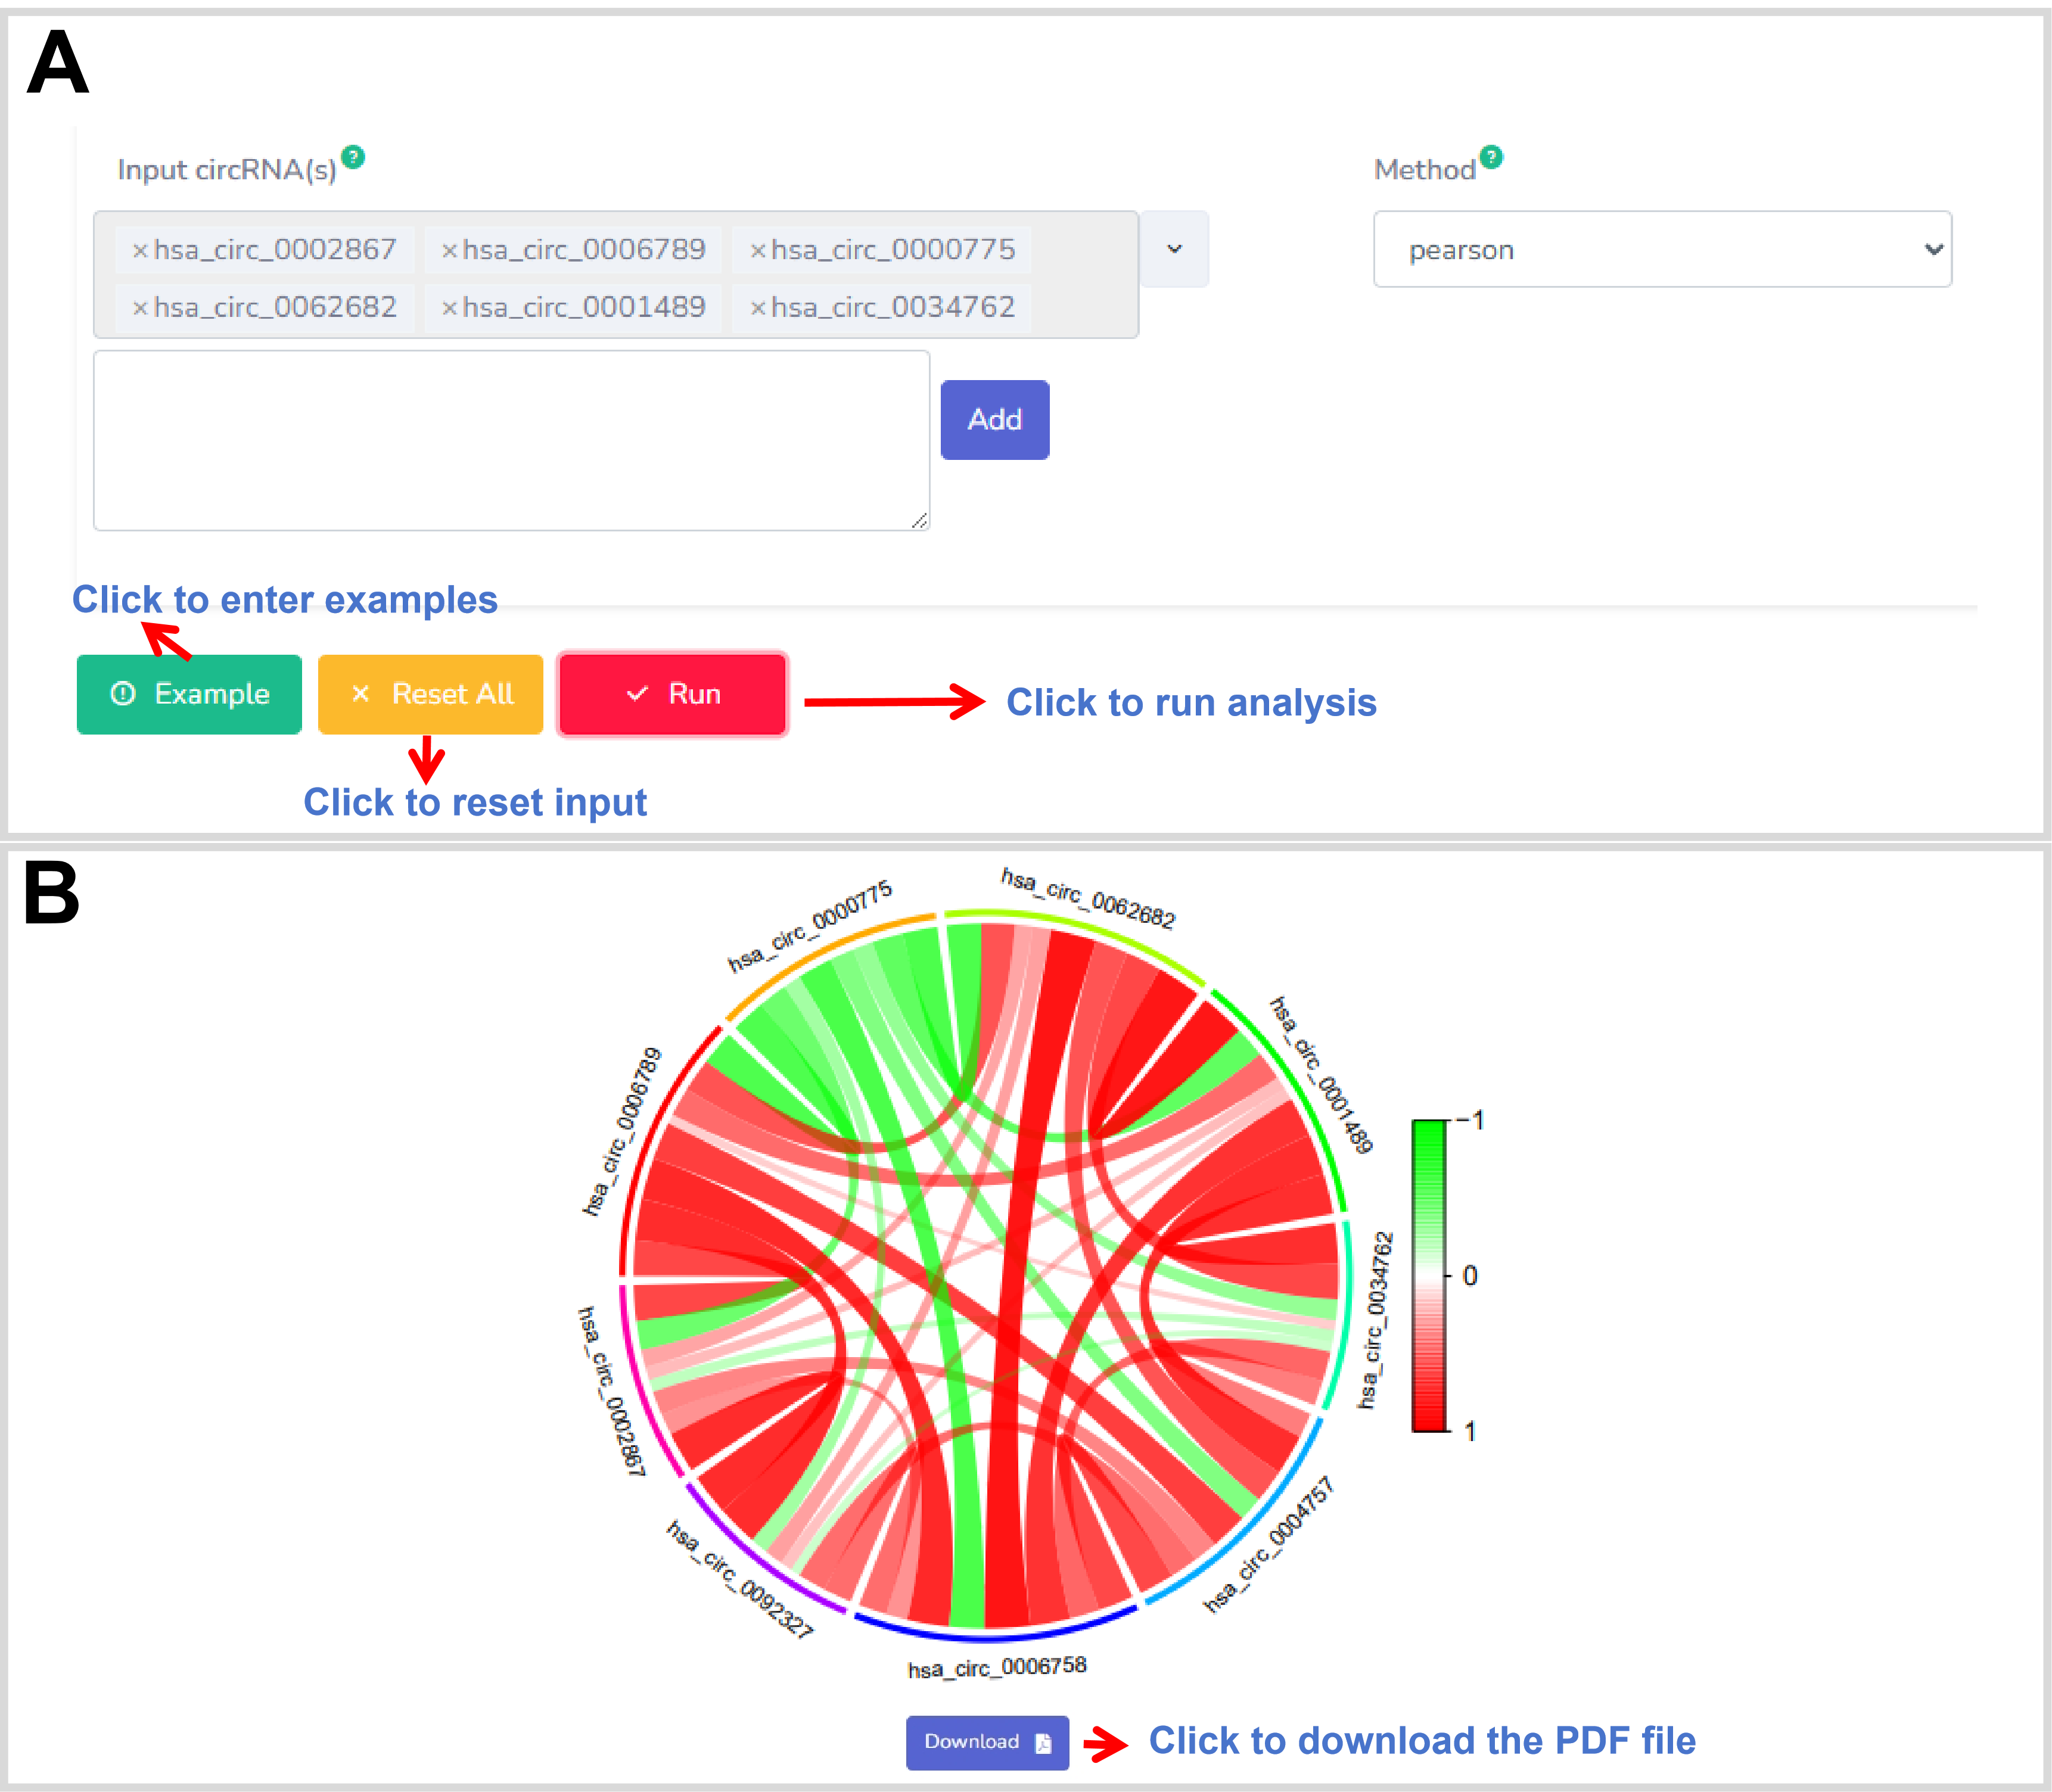
Figure 23. The web interface of the CircosPlot.
Description:
The NetworkPlot analysis function aims to depict the correlationships among multiple
circRNAs in the specific physiological and pathological condition. The result
displays as a network plot, which can be freely downloaded and saved as a PDF file
with high resolution (Figure 24).
R package(s): The dplyr, stringr and reshape2 package is used for the
data processes. The cor.test function is used for the co-expression analysis. The
igraph packages are used for the NetworkPlots.
Parameter(s): circRNA(s):at least three circBase IDs;Correlation cutoff: :a threshold value for the significant correlation;Method:including pearson, kendall, and spearman.
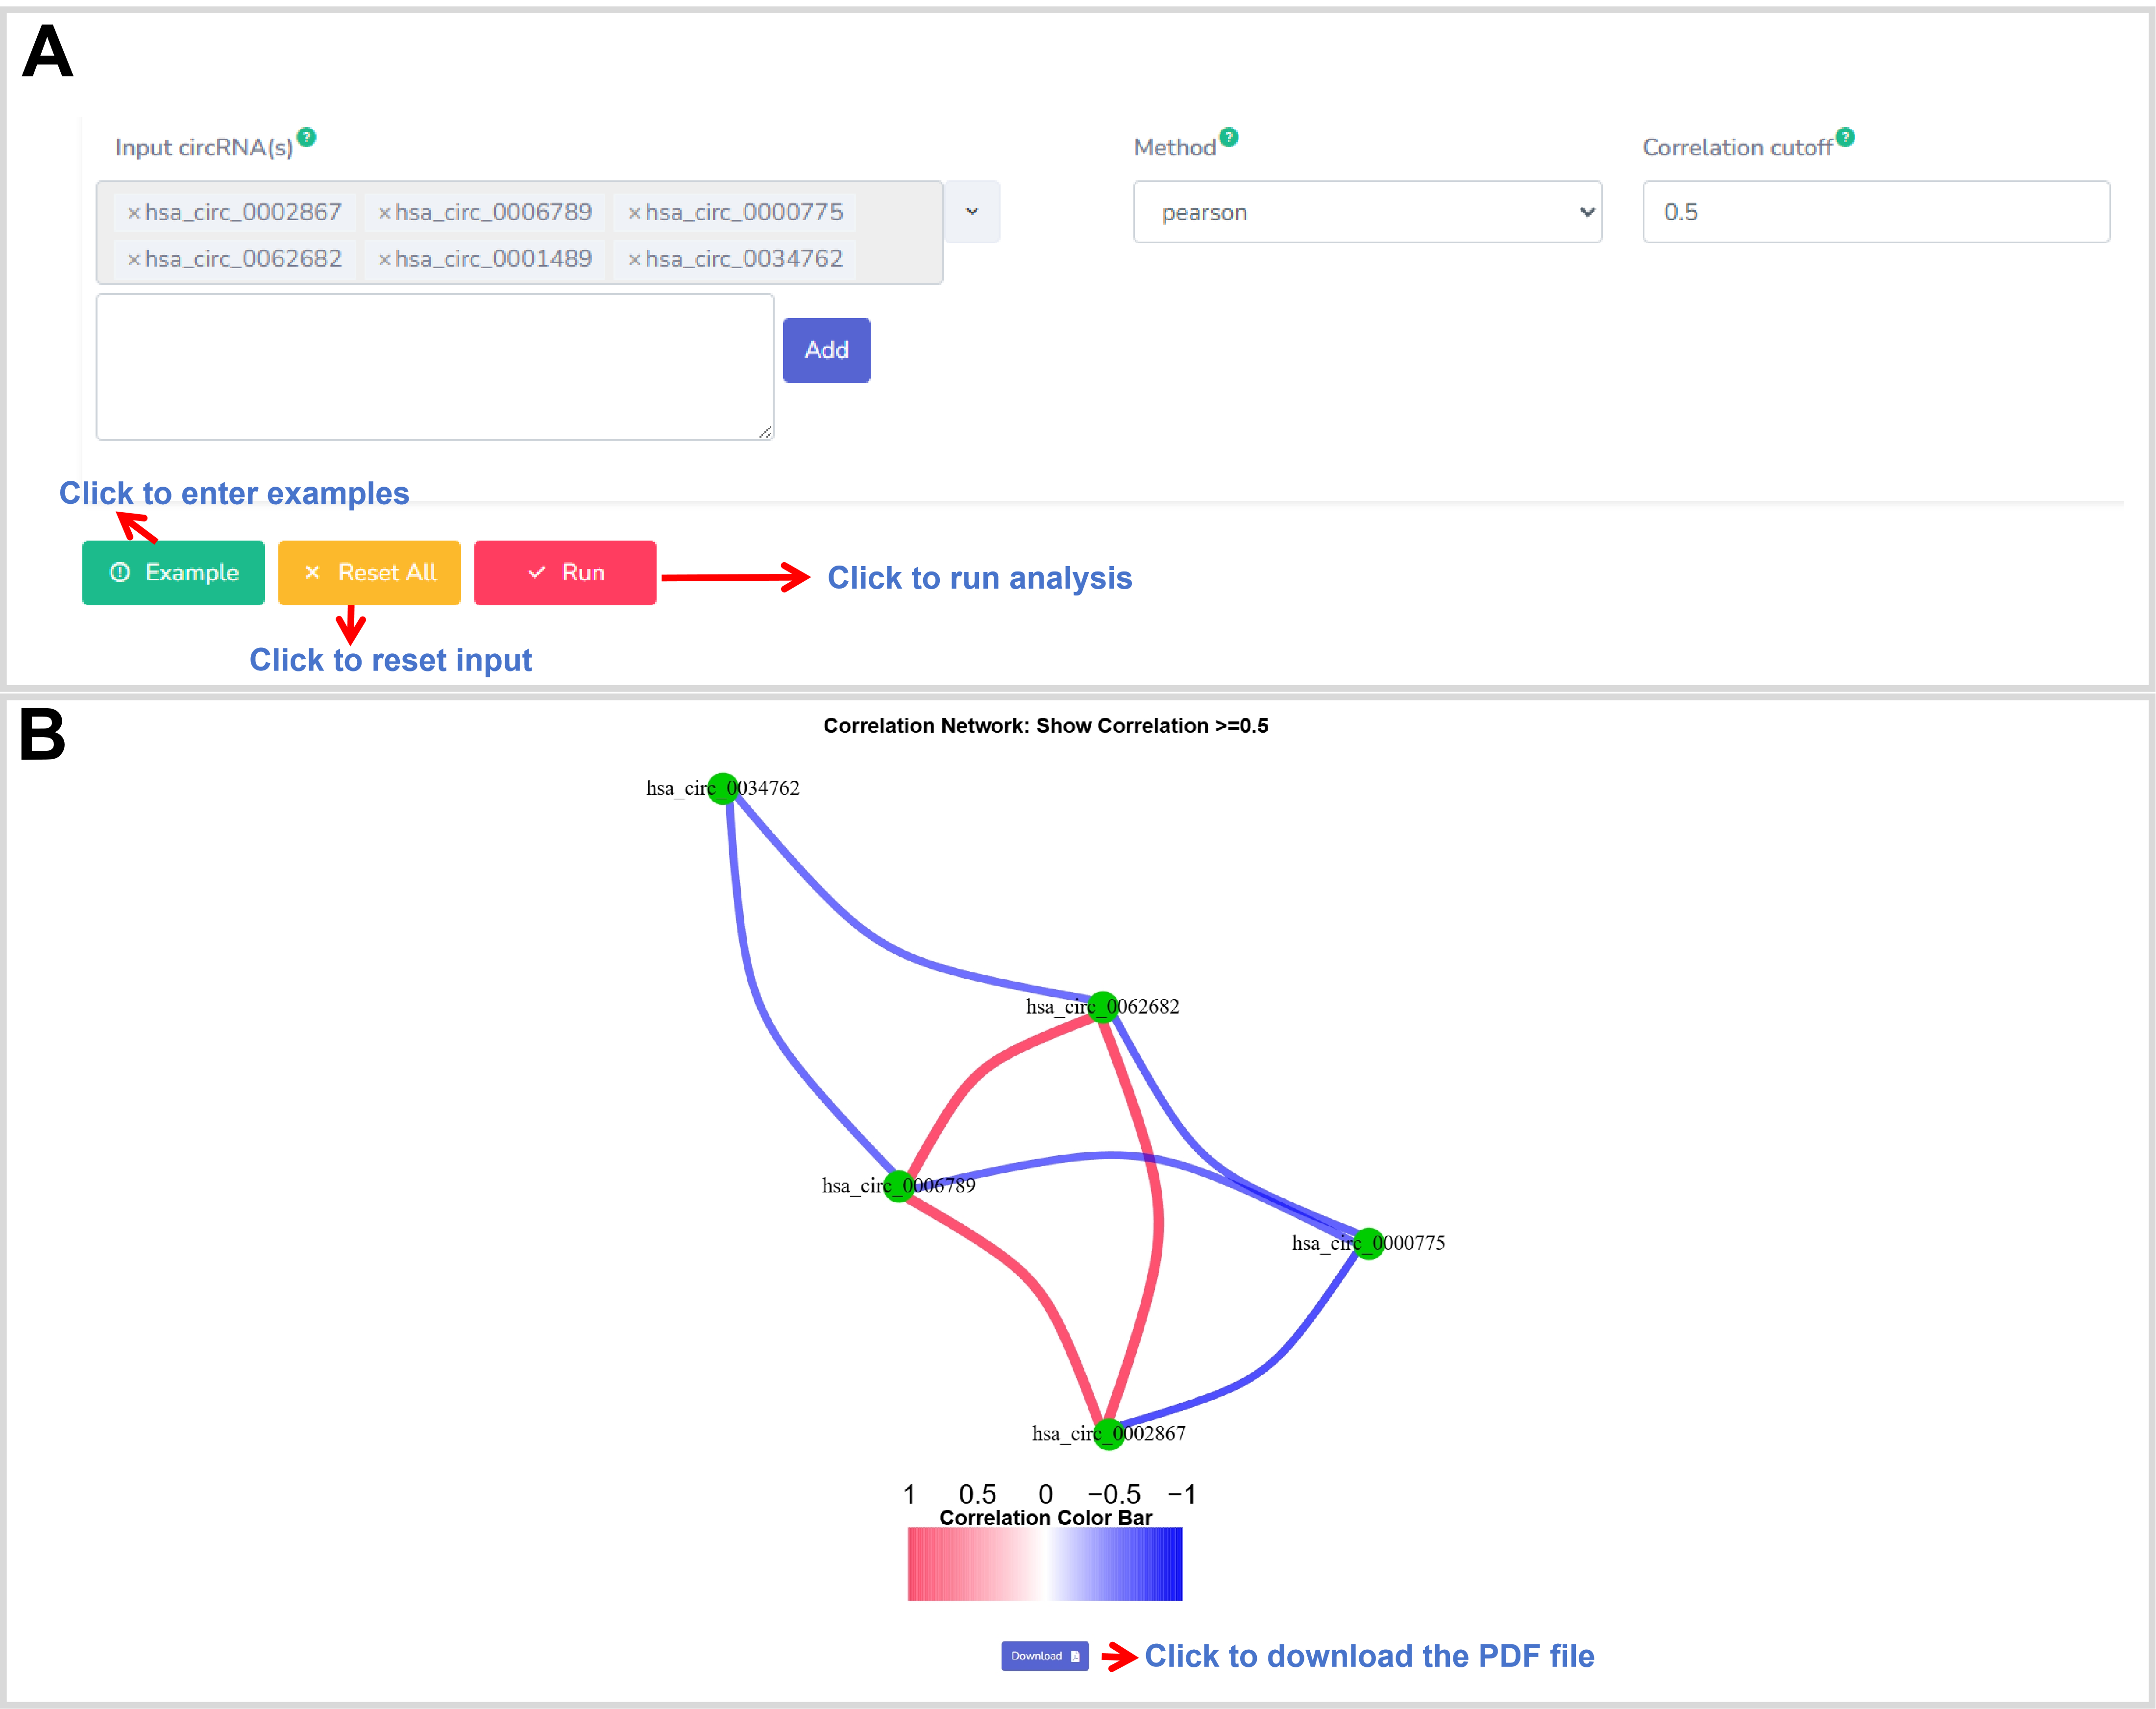
Figure 24. The web interface of the NetworkPlot.
Description:
GO enrichment in the Co-expression module is a helpful application to identify the
biological functions of circRNA based on the GO annotations of the host genes of its
co-expression circRNAs in the specific physiological and pathological condition. The
results are displayed as a table, a bar plot, and a dot plot. The bar plot and dot
plot can be freely downloaded and saved as a PDF file with high resolution (Figure
25). A menu at the table header can be used to set columns and rows to show
interesting information. The filter box allows to quick search. In addition, right
clicking on the table body displays an instruction form to copy and export the
table. Moreover, the GO ID links to the GO resource for the detail information of
the GO term.
R package(s): The cor.test function is used for the co-expression
analysis. The dplyr, jsonlite, stringr, limma, ggplot2, clusterProfiler,
org.Hs.eg.db,
topGO, and Rgraphviz packages are used for the GO enrichment analysis,
involving in the data processes, dot plot, and bar plot.
Parameter(s): circRNA:a circBase ID;Correlation cutoff:a threshold value to define the significant correlation;Correlation p-value cutoff:a threshold p-value to define the significant correlation;GO-p-value:a threshold p-value for the enriched GO term;GO-q-value:a threshold q-value for the enriched GO term;GO-type:including All (all GO terms), BC (biological processes GO terms), CC (cell components GO terms), and MF (molecular functions GO terms);Method:including pearson, kendall, and spearman;
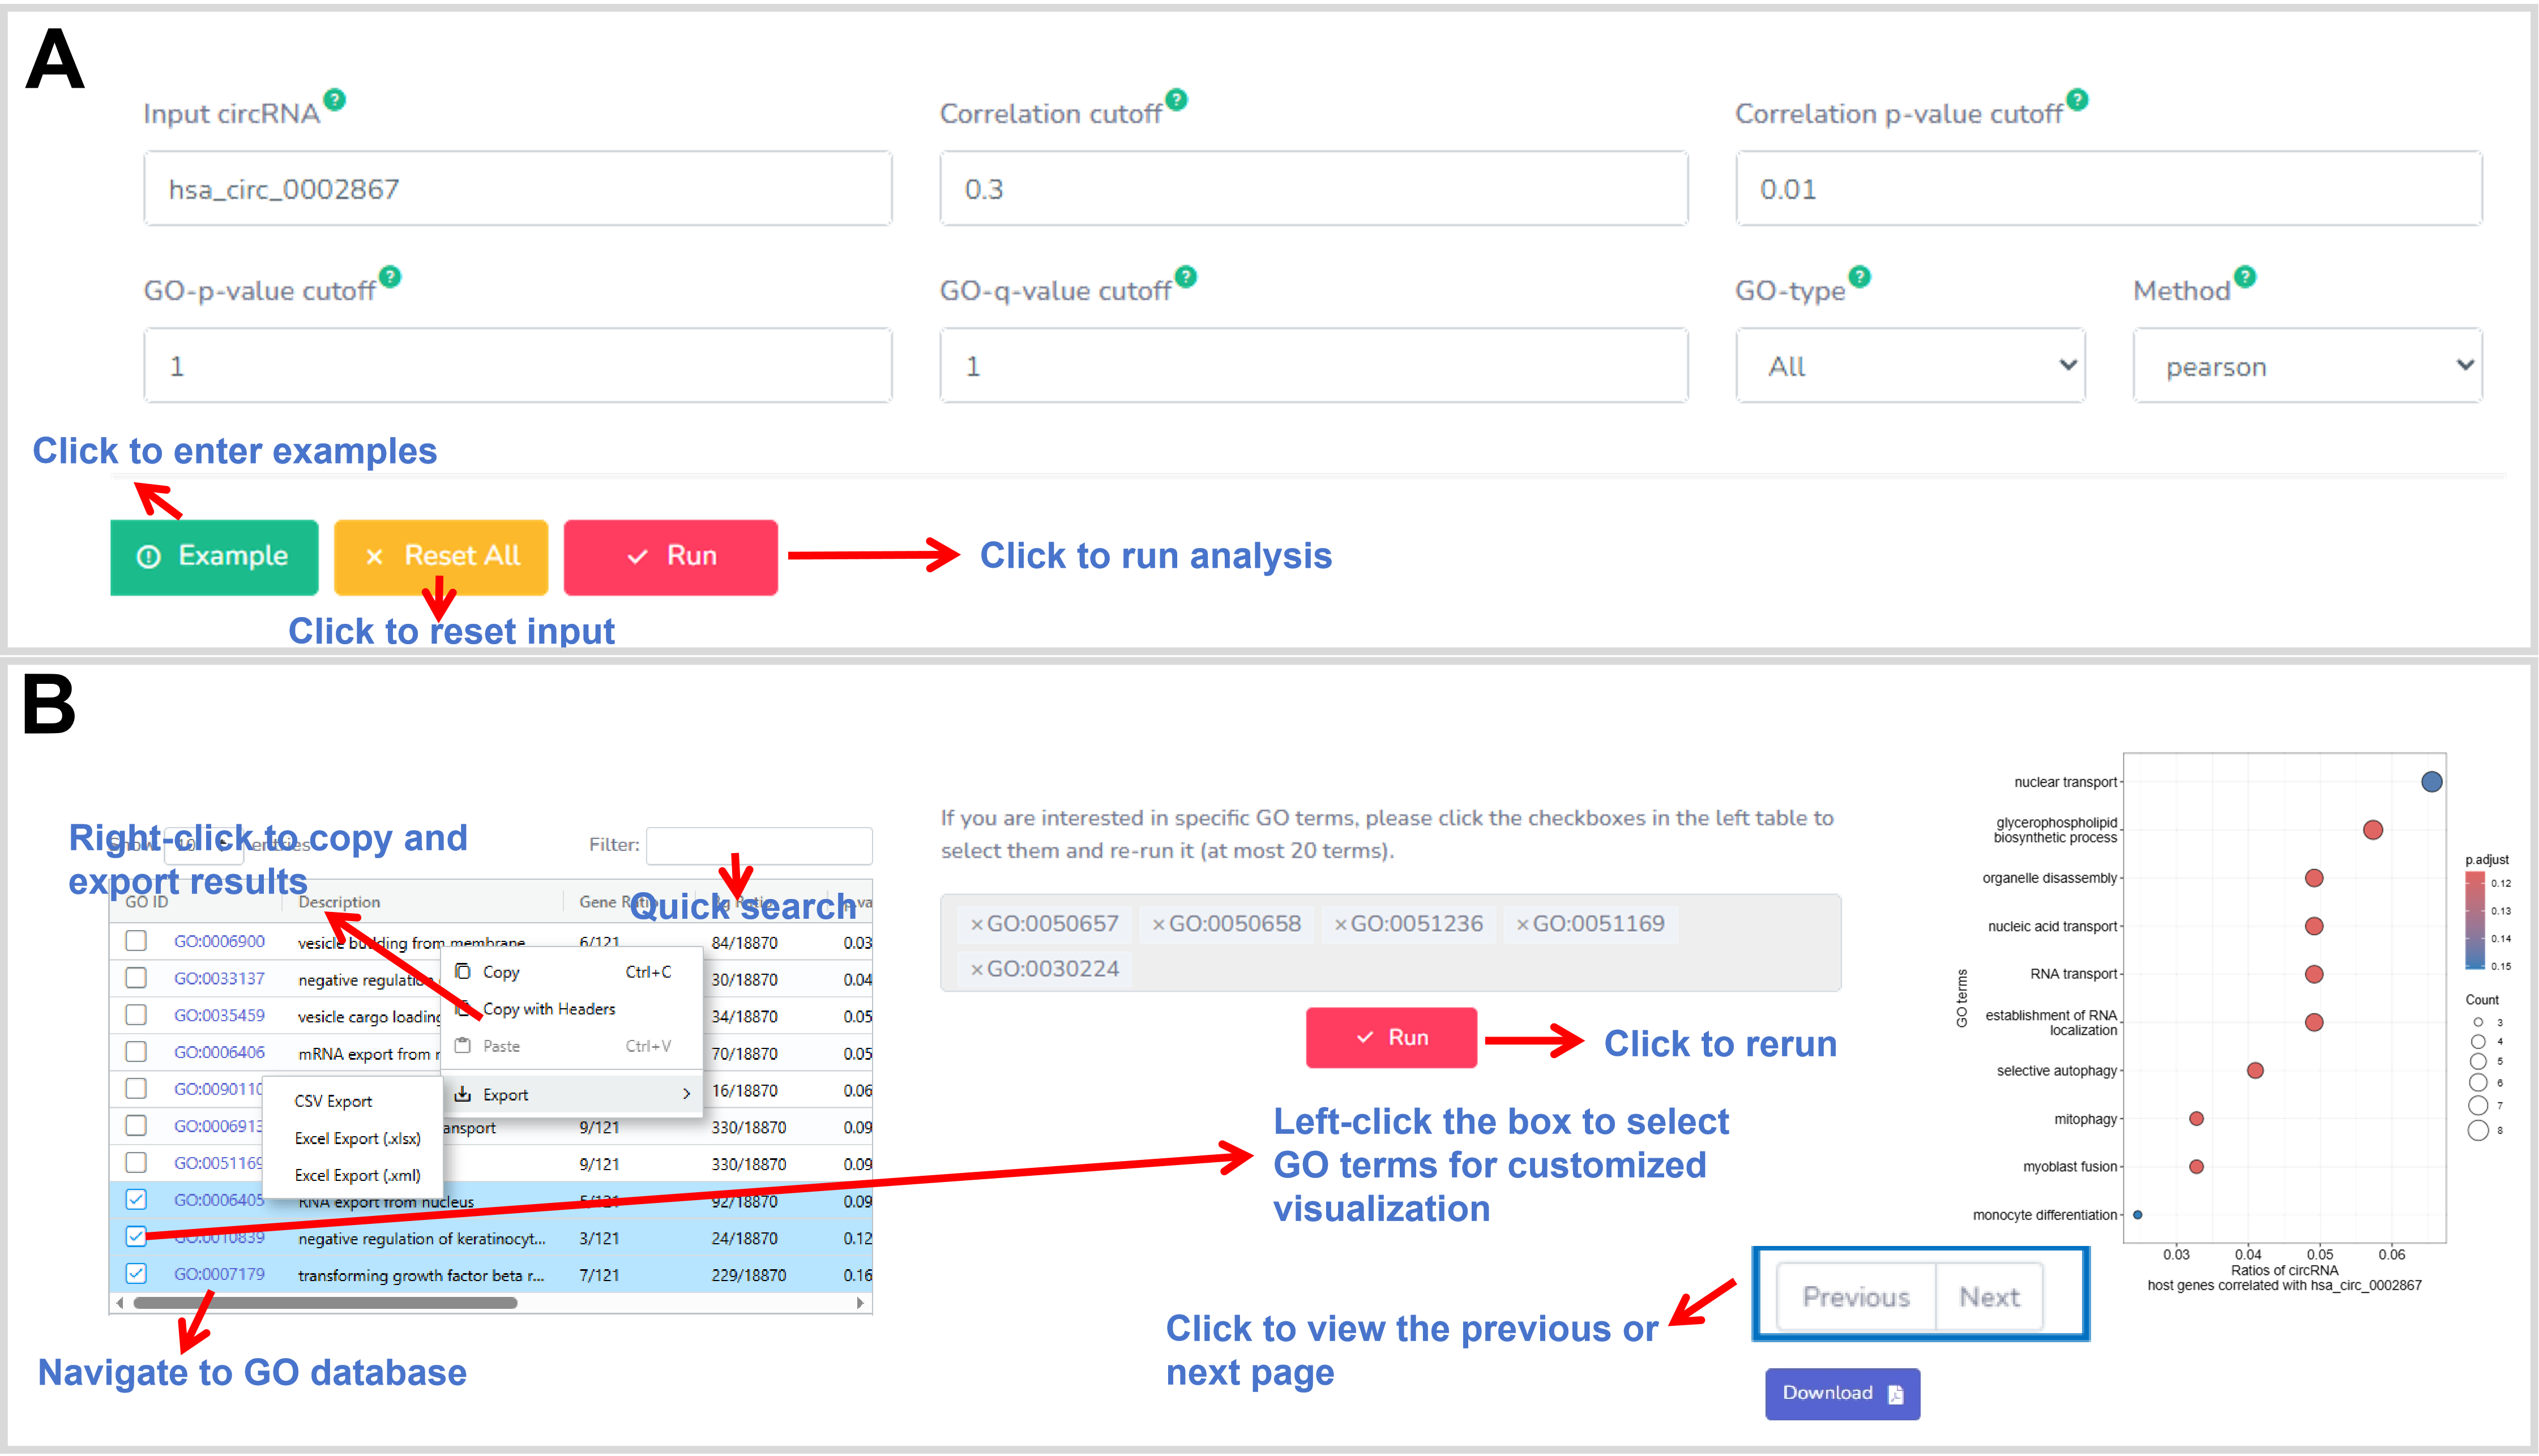
Figure 25. The web interface of the GO enrichment in the Co-expression module.
Description:
KEGG enrichment in the Co-expression module is a helpful application to identify the
biological pathways of circRNAs based on the KEGG pathway annotations of the host
genes of its co-expression circRNAs in the specific physiological and pathological
condition. The results are displayed as a table, a bar plot, and a dot plot, The bar
plot and dot plot can be freely downloaded and saved as a PDF file with high
resolution (Figure 26). A menu at the table header can be used to set columns and
rows to show interesting information. The filter box allows to quick search. In
addition, right clicking on the table body displays an instruction form to copy and
export the table. Moreover, the KEGG ID links to the KEGG resource for the detail
information of the KEGG term.
R package(s): The cor.test function is used for the co-expression
analysis. The dplyr, jsonlite, stringr, limma, ggplot2, clusterProfiler,
org.Hs.eg.db,
Rgraphviz, and pathviewpackages are used for the KEGG
enrichment analysis, including the data processes, dot plot, and bar plot.
Parameter(s): circRNA:a circBase ID;Correlation cutoff:a threshold value to define the significant correlation;Correlation p-value cutoff:a threshold p-value to define the significant correlation;KEGG-p-value:a threshold p-value for the enriched KEGG term;KEGG-q-value:a threshold q-value for the enriched KEGG term;Method:including pearson, kendall, and spearman;
Figure 26. The web interface of the KEGG enrichment in the Co-expression module.
6. WGCNA module
Description:
The WGCNA module was developed to perform various aspects of weighted correlation network
analysis (WGCNA) on the circRNAs, including network construction, module detection, circRNA
selection, calculations of topological properties, data simulation, GO and KEGG
function/pathway enrichment analysis based on the WGCNA package. All of results from the
analyses can be displayed as a graph or table for freely download and saving as a PDF file
with high resolution. Moreover, the table results provide a filter box lets to quick search
and a menu at the table header to allow users for fitting columns and rows to show their
interesting data. In addition, right clicking on the table body will displays an instruction
form to copy and export the table results for further analyses (Figure 27).
R package(s): The dplyr, jsonlite, WGCNA, clusterProfiler, ggplot2, and
scatterplot3d packages are used for the WGCNA analysis, involving in the data processes, dot
plot, and bar plot.
Parameter(s): Number of circRNAs:numbers of top variable circRNAs, e.g.: 1000, be aware of “Total number of circRNAs in the dataset”;Method:a method for sample clustering and module eigen-circRNAs;MinModule Size:minimum number of circRNAs in each module;MEDissThres:a threshold to plot the cut line into the dendrogram abline.
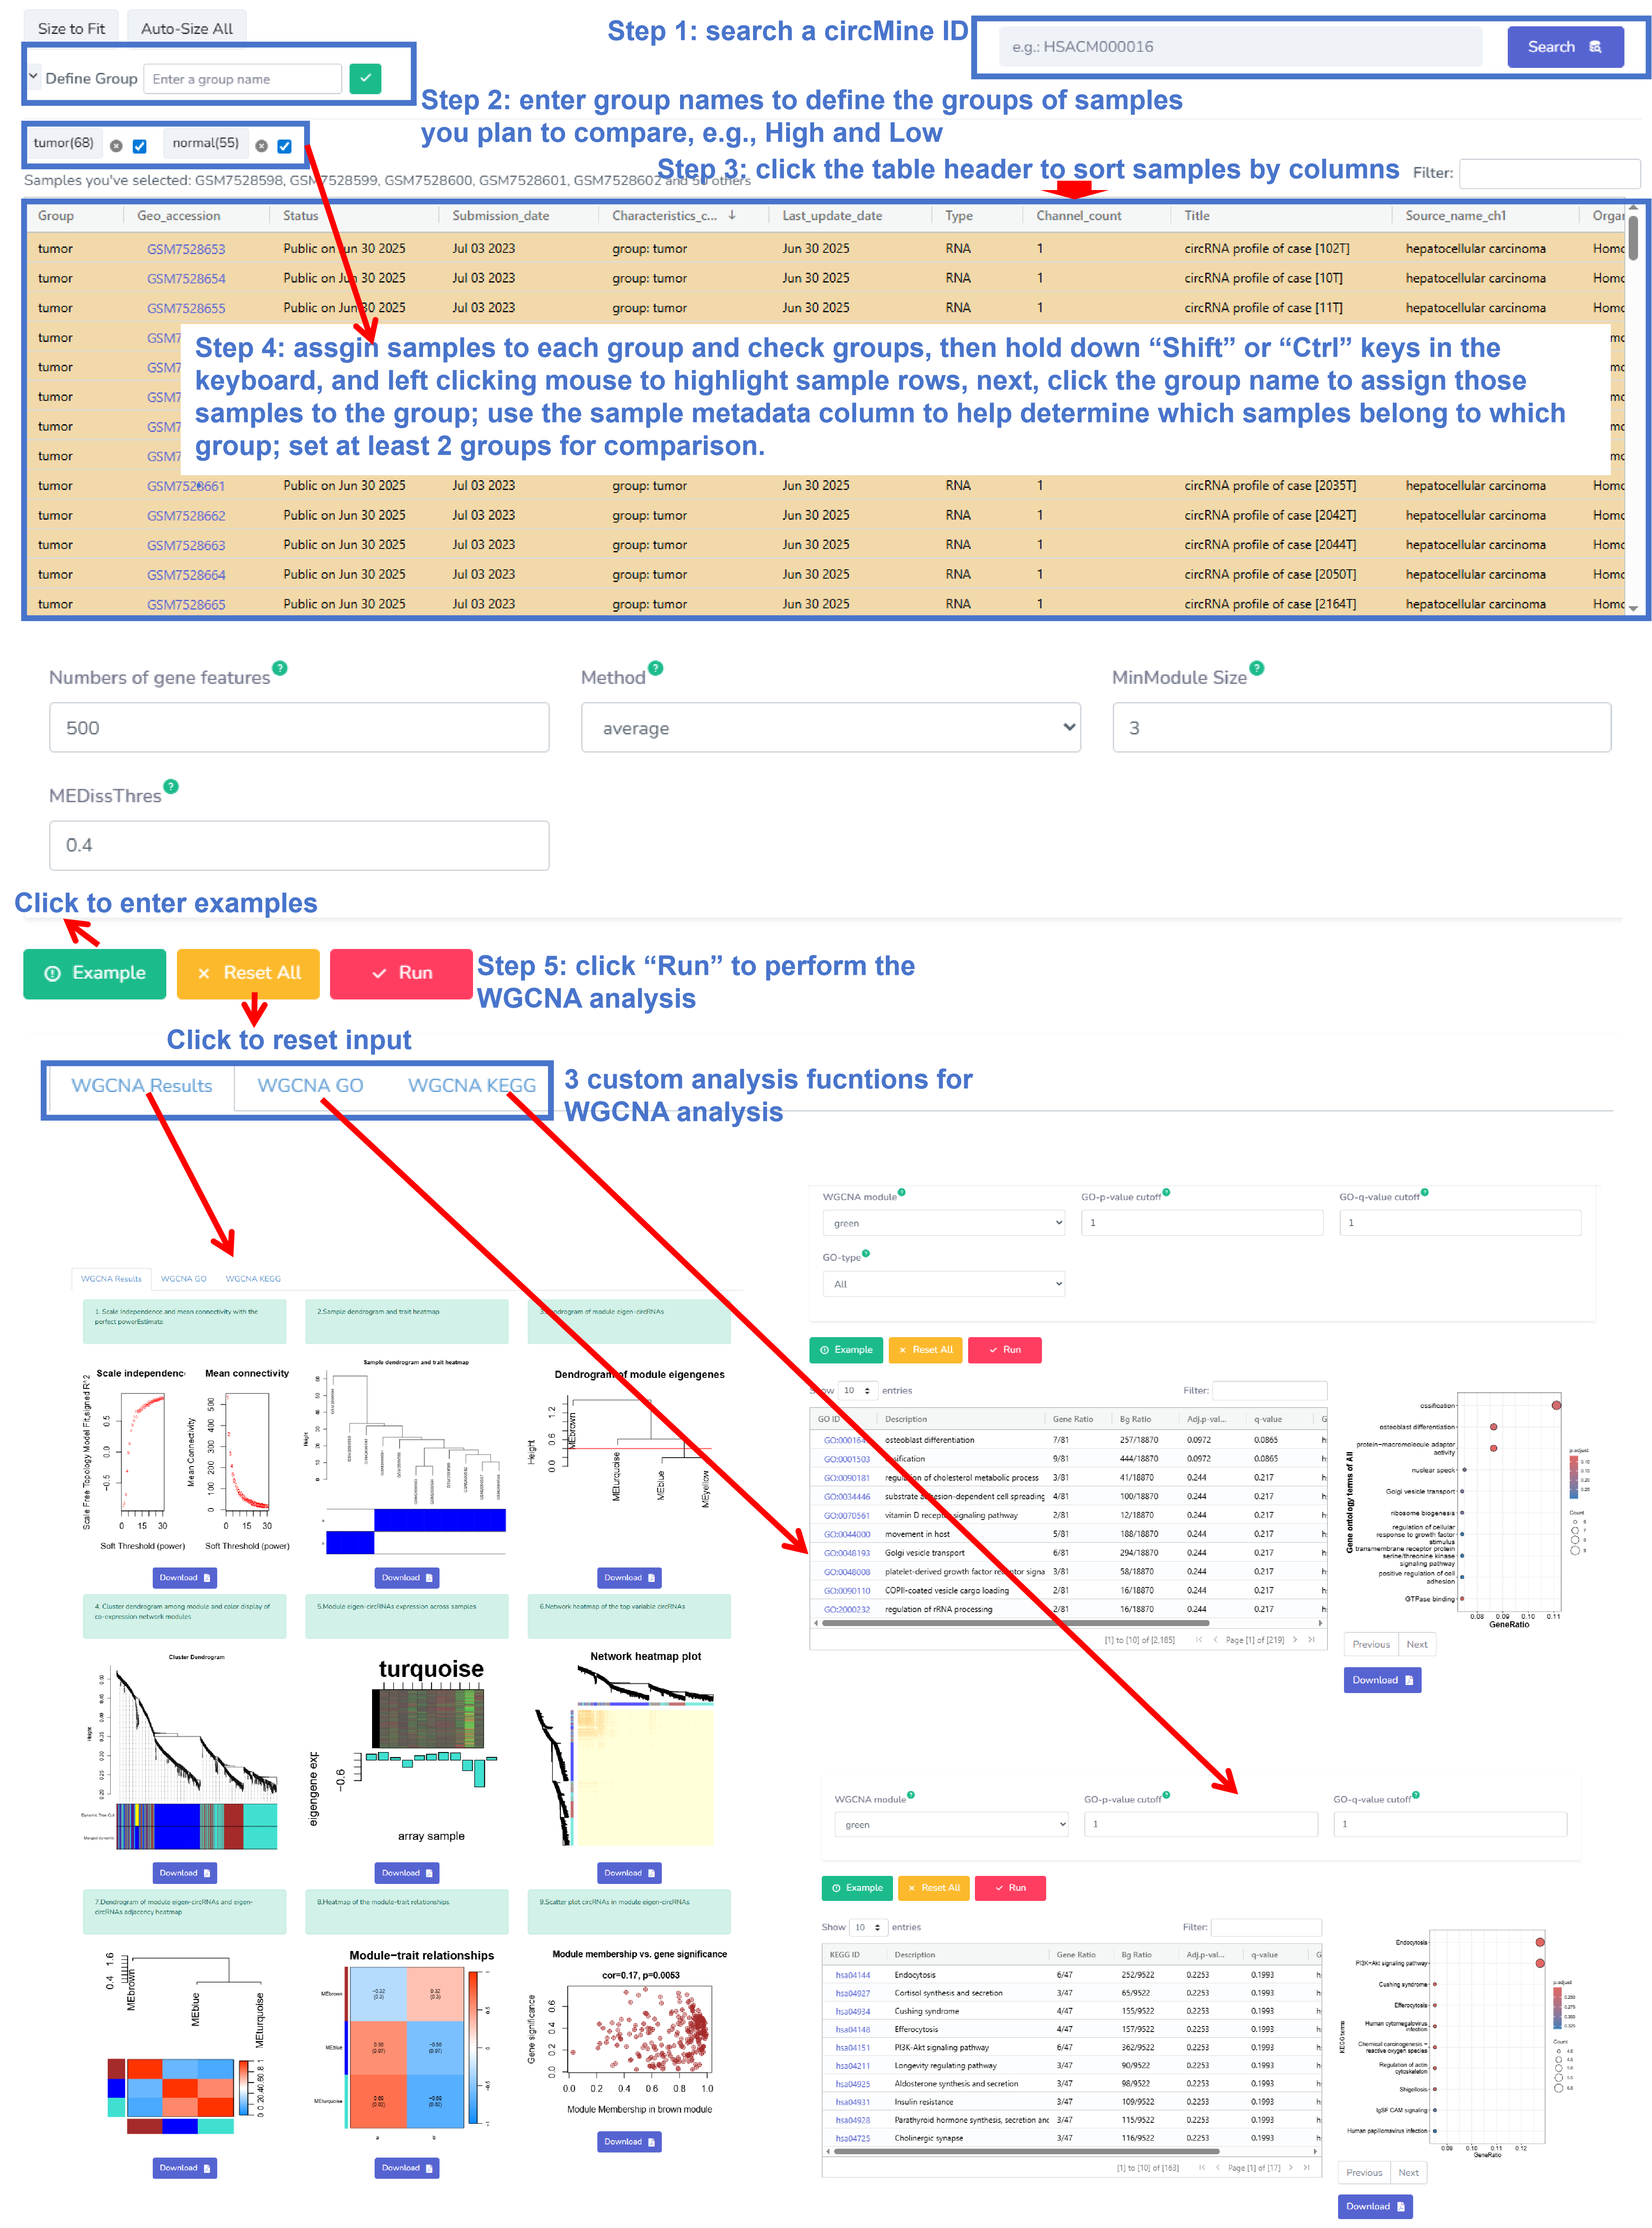
Figure 27. The web interface of the WGCNA module.
7. Feature-selection module
The Feature-selection module provides 2 analysis functions to comprehensively
investigate the circRNA transcriptomic data for the discovery and identification of
important circRNAs (Figure 28). Currently, the two analysis functions include
LASSO and
ROC. Moreover,
all of these analysis functions are allowed to custom grouping based on the sample metadata
of the dataset. To assign samples to each group, users can hold down the Shift or Ctrl keys
and click left mouse button to highlight and select the sample rows. Users further click the
group name, which can assigns these samples to the group. All of the results from the two
analysis functions can be displayed as a graph or table. The graph results can be freely
downloaded and saved as a PDF file with high resolution, while the table results provide a
filter box that allows to quick search and a menu at the table header to fit columns and
rows to show and filter data. In addition, right clicking on the table body will displays an
instruction form to copy and export the table results for further analyses. We have detailed
these analysis functions underneath.
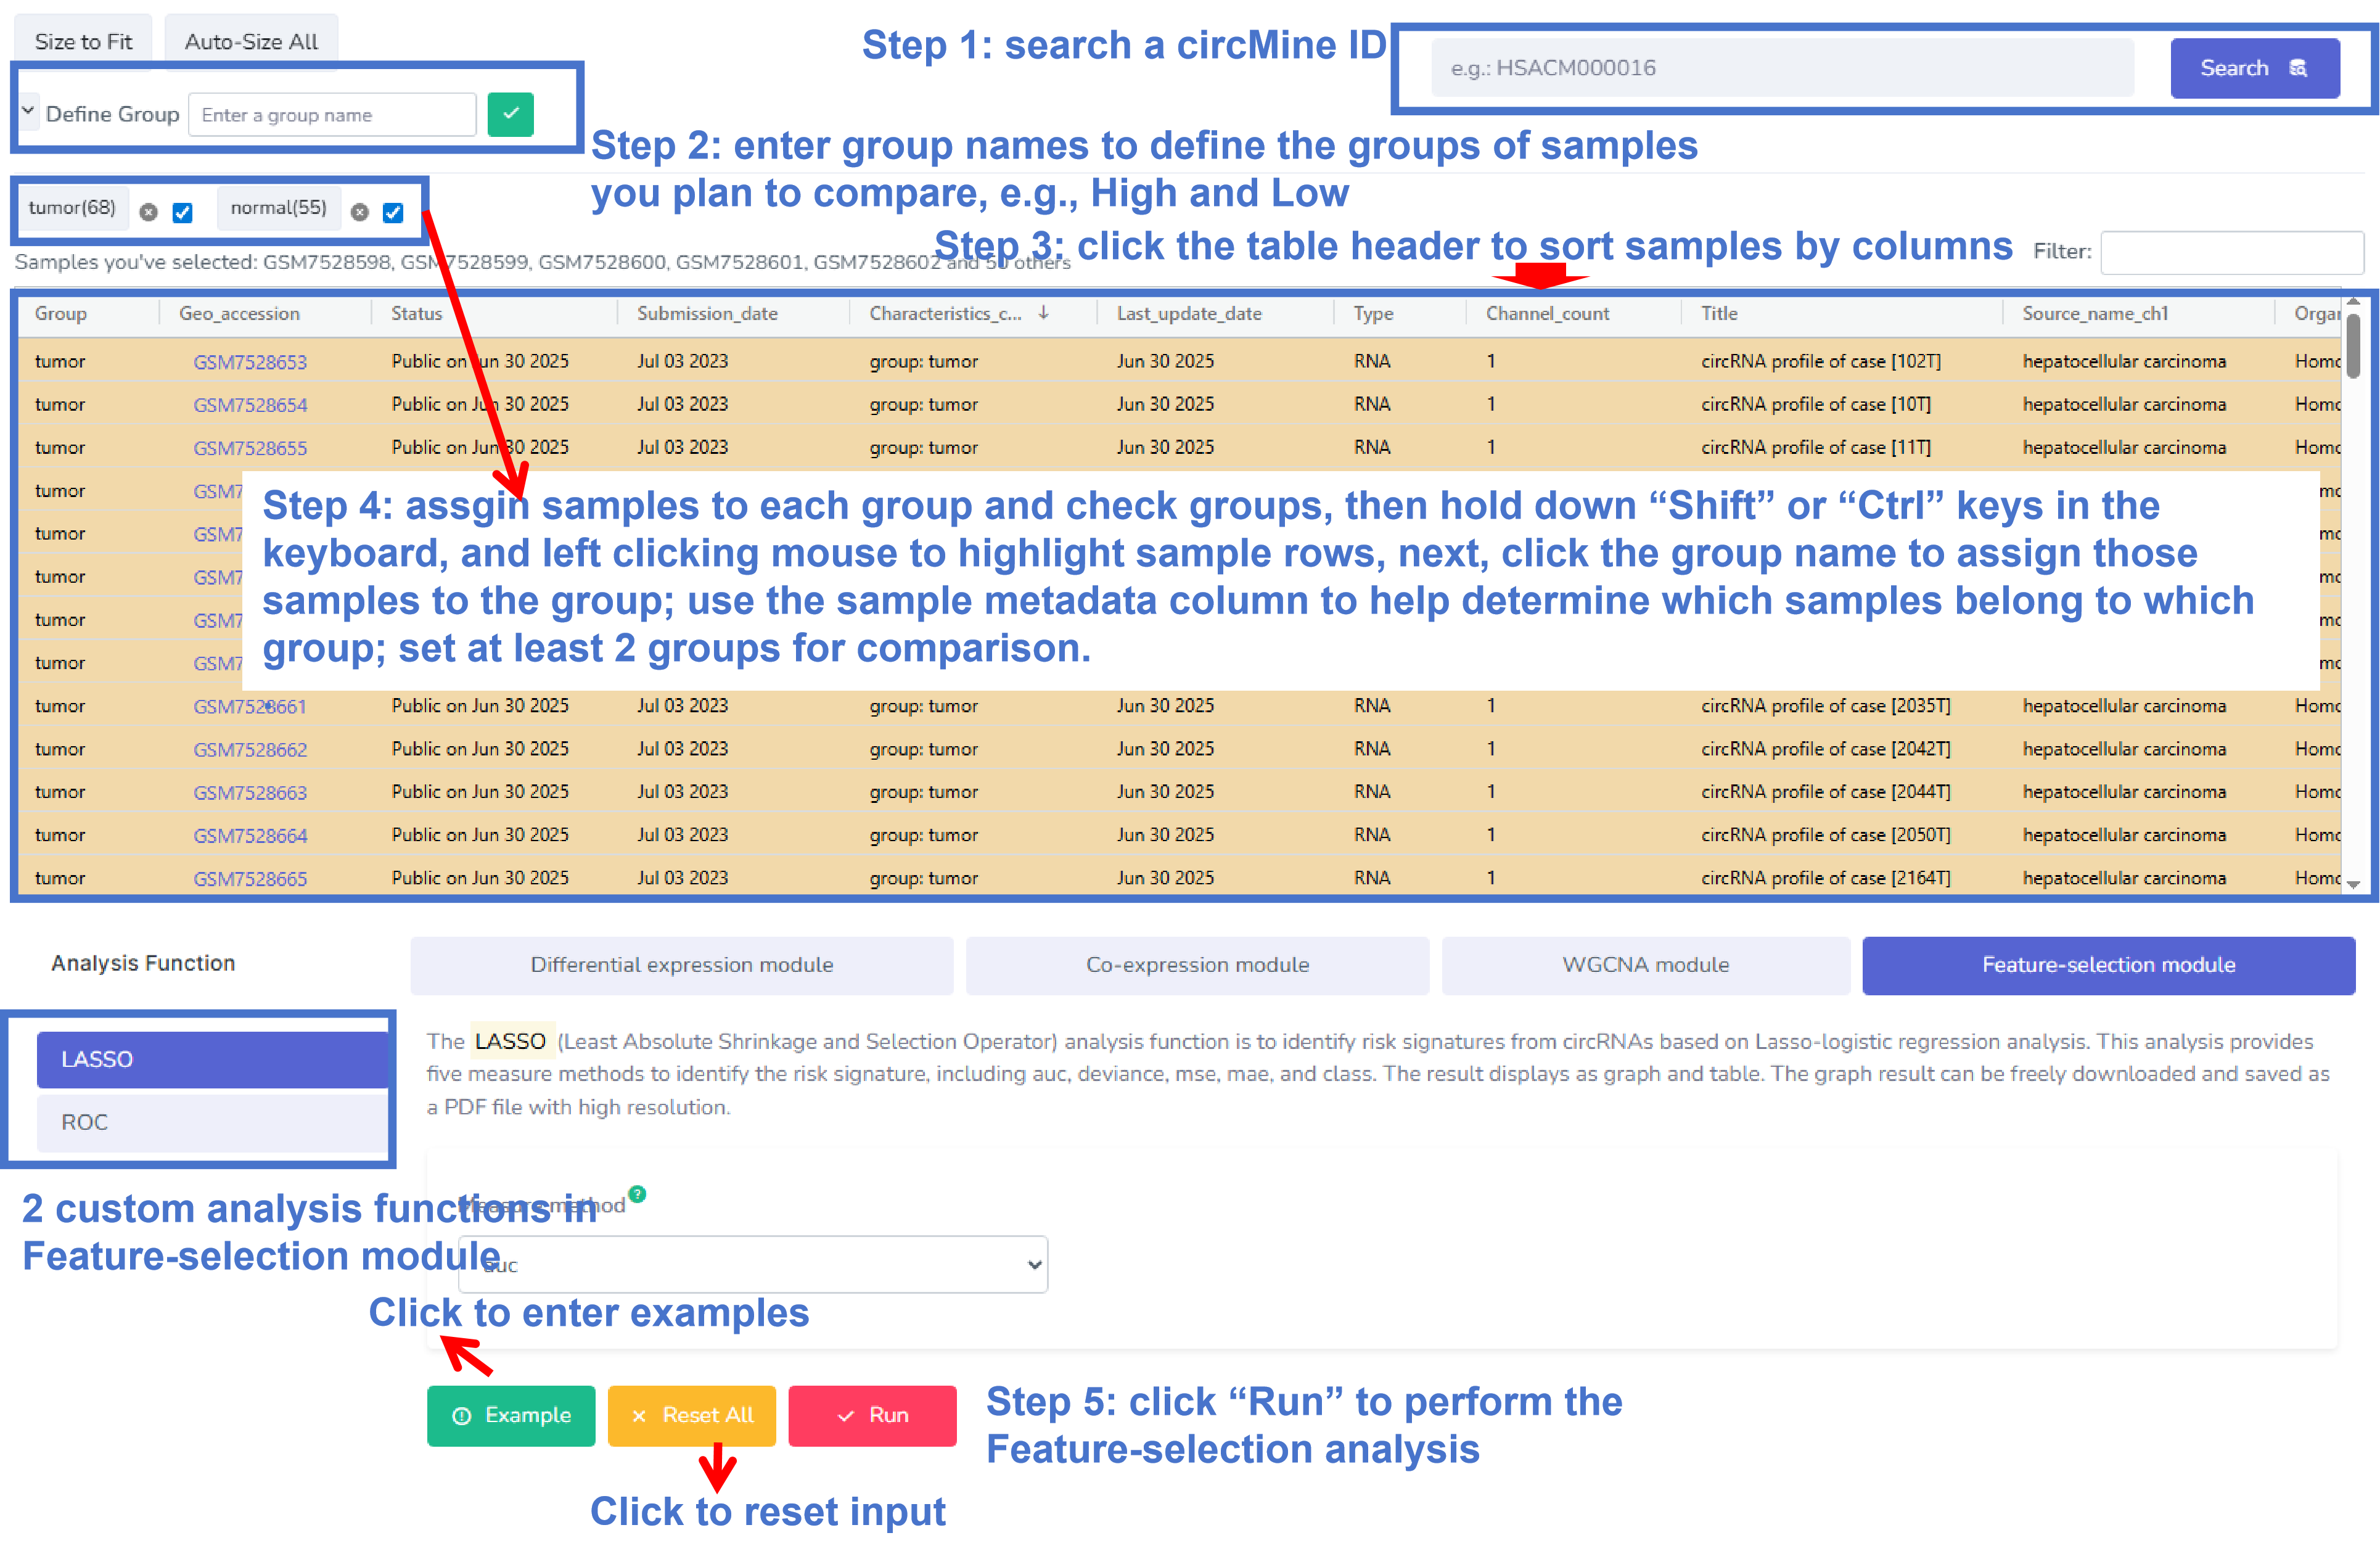
Figure 28.The web interface of the Feature-selection module.
Description: The LASSO analysis function is to identify risk circRNAs
based on Lasso-logistic regression analysis. This analysis provides five measure
methods to identify the risk signature, including auc, deviance, mse, mae, and
class. The result displays as graph and table. The graph result can be freely
downloaded and saved as a PDF file with high resolution (Figure 29) . A menu at the
table header can be used to set columns and rows to show the interesting
information. The filter box allows to quick search. In addition, right-clicking on
the table body displays an instruction form to copy and export the table.
R package(s): The dplyr and jsonlite packages are used for the data
processes. The glmnet and foreign packages are used for the LASSO-logistic
regression analysis.
Parameter(s):Measure method:including auc, deviance, mse, mae, and class.
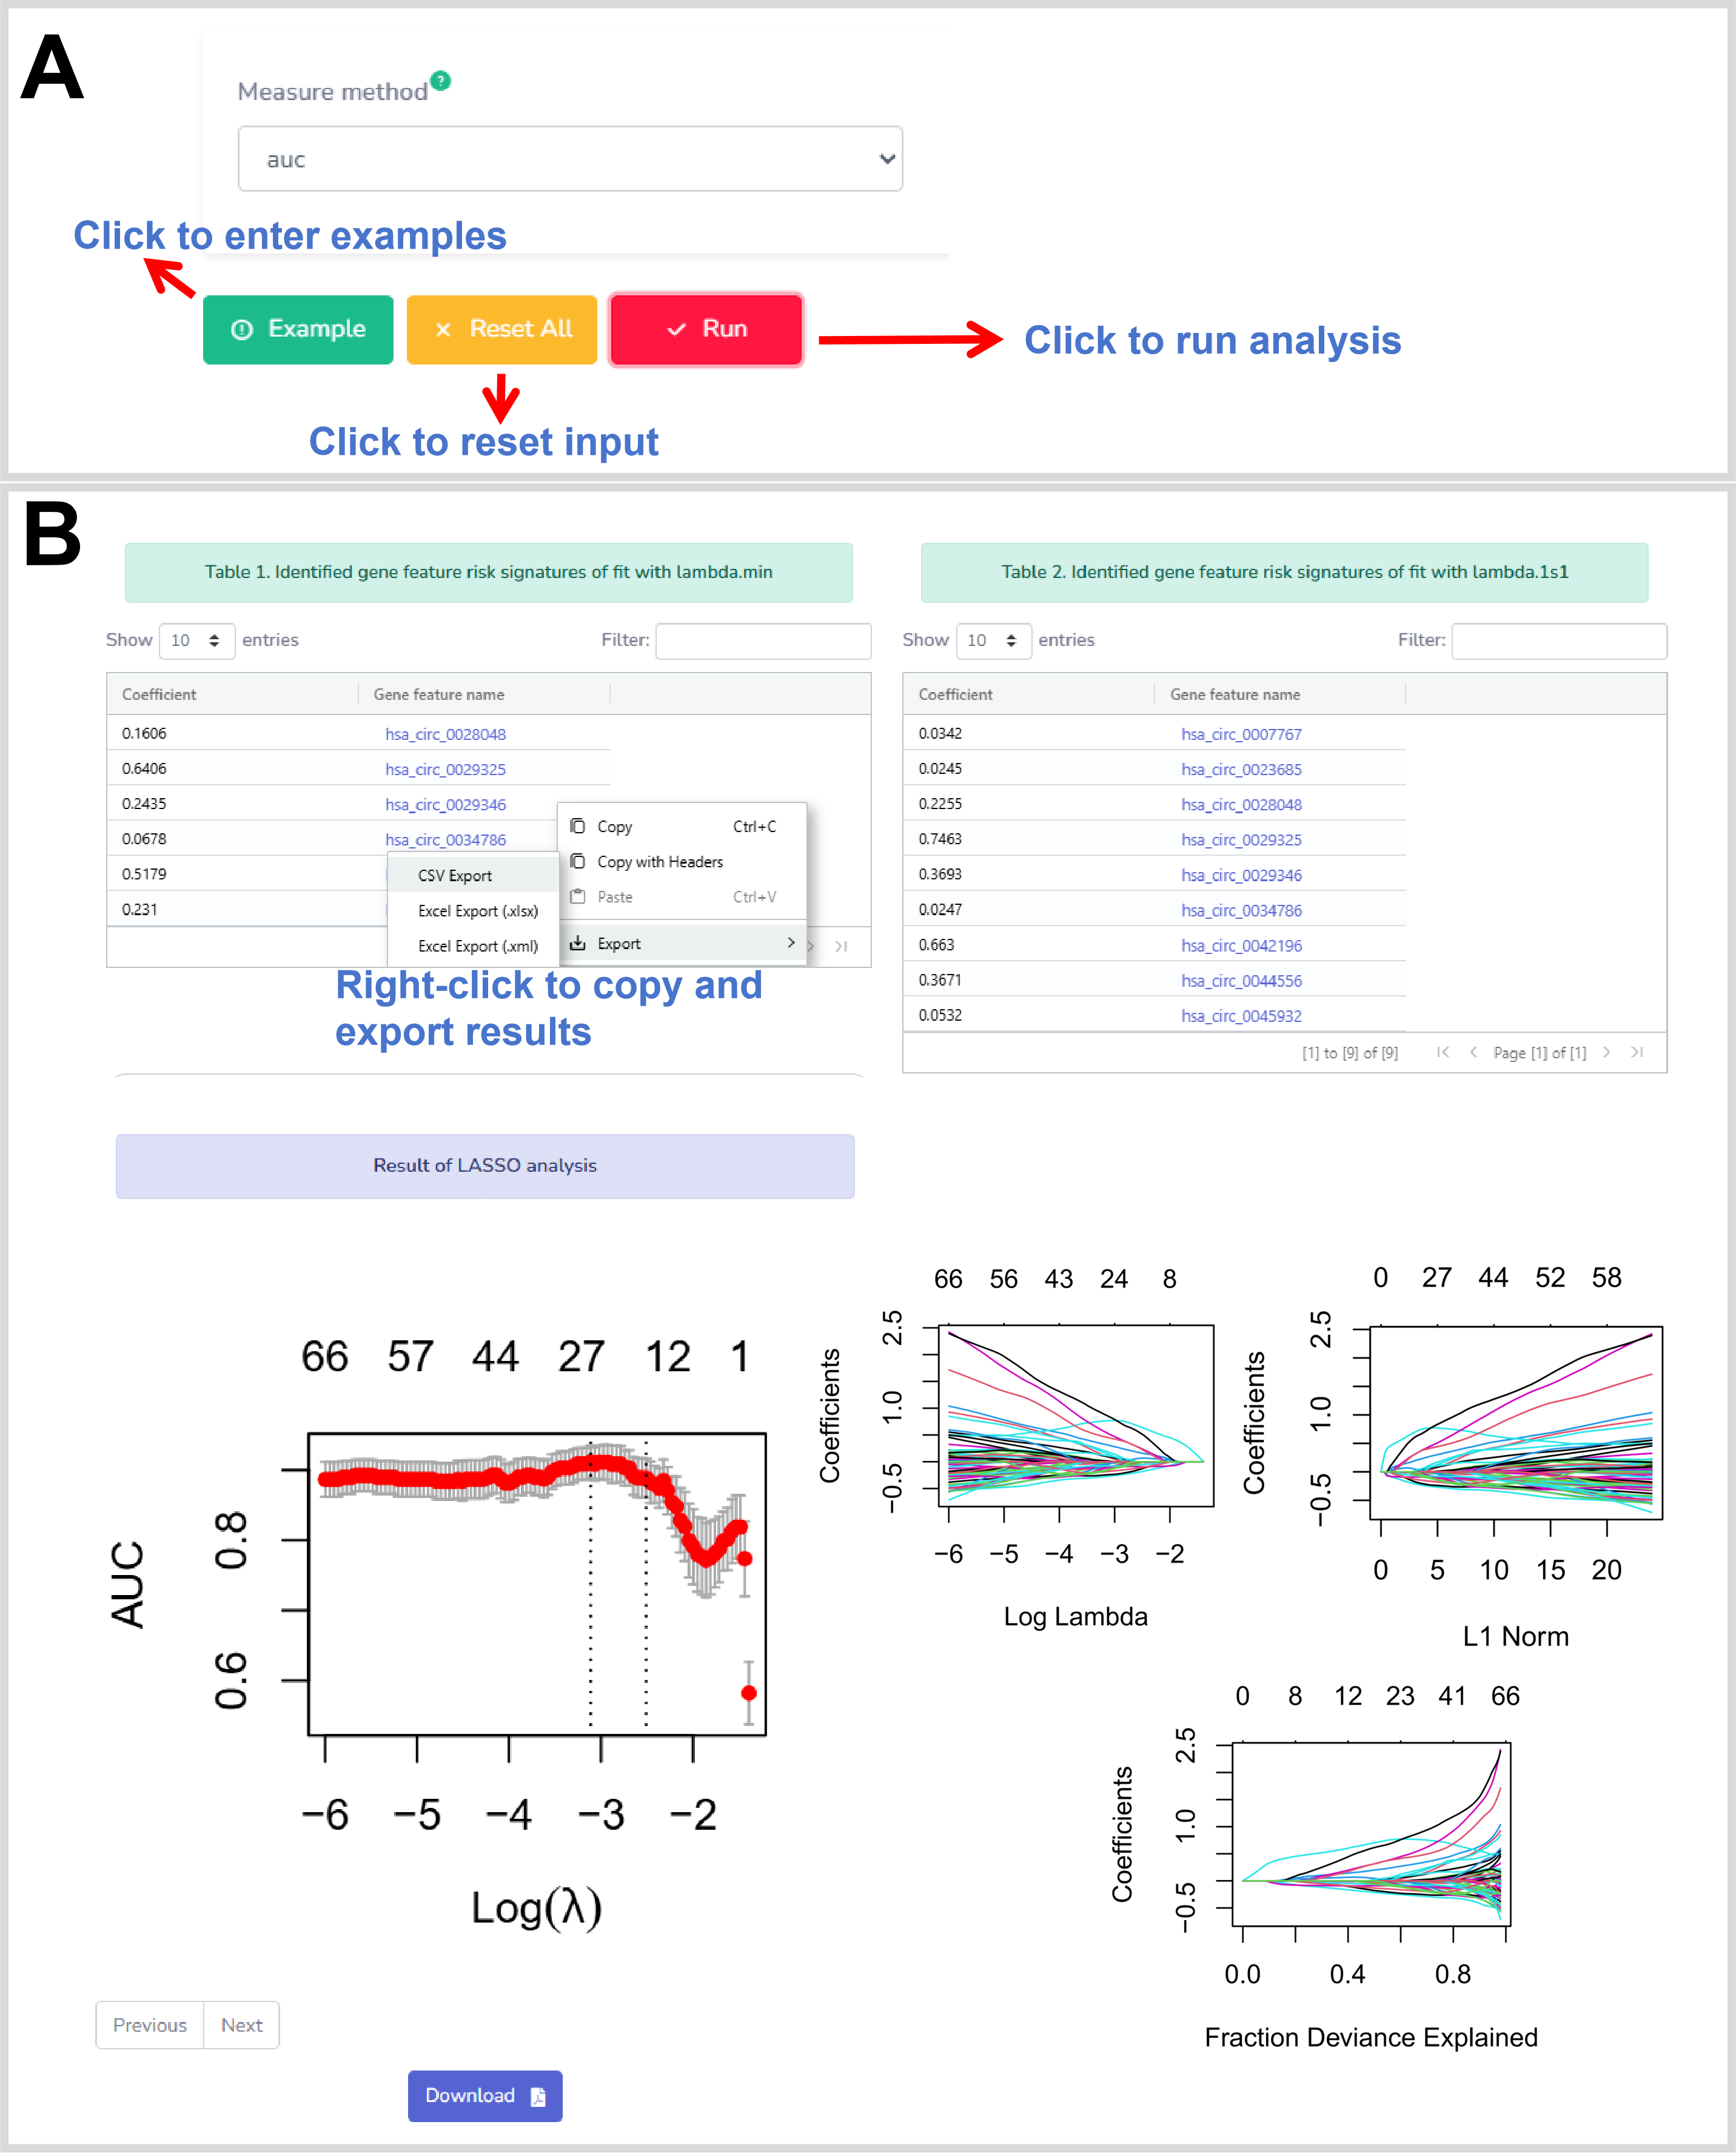
Figure 29. The web interface of the LASSO.
Description: The ROC (Receiver Operating Characteristic) analysis
function has designed to plot ROC curves to estimate the predictive performance of
interesting circRNA(s) for phenotype. The result displays as graphs, which can be
freely downloaded and saved as a PDF file with high resolution (Figure 30).
R package(s):The tidyverse package is used for the data processes.
The ROCR, plotROC, ggpubr, and randomcoloR package is used for the ROC analysis.
Parameter(s):Input circRNA(s):enter one or more circBase IDs.
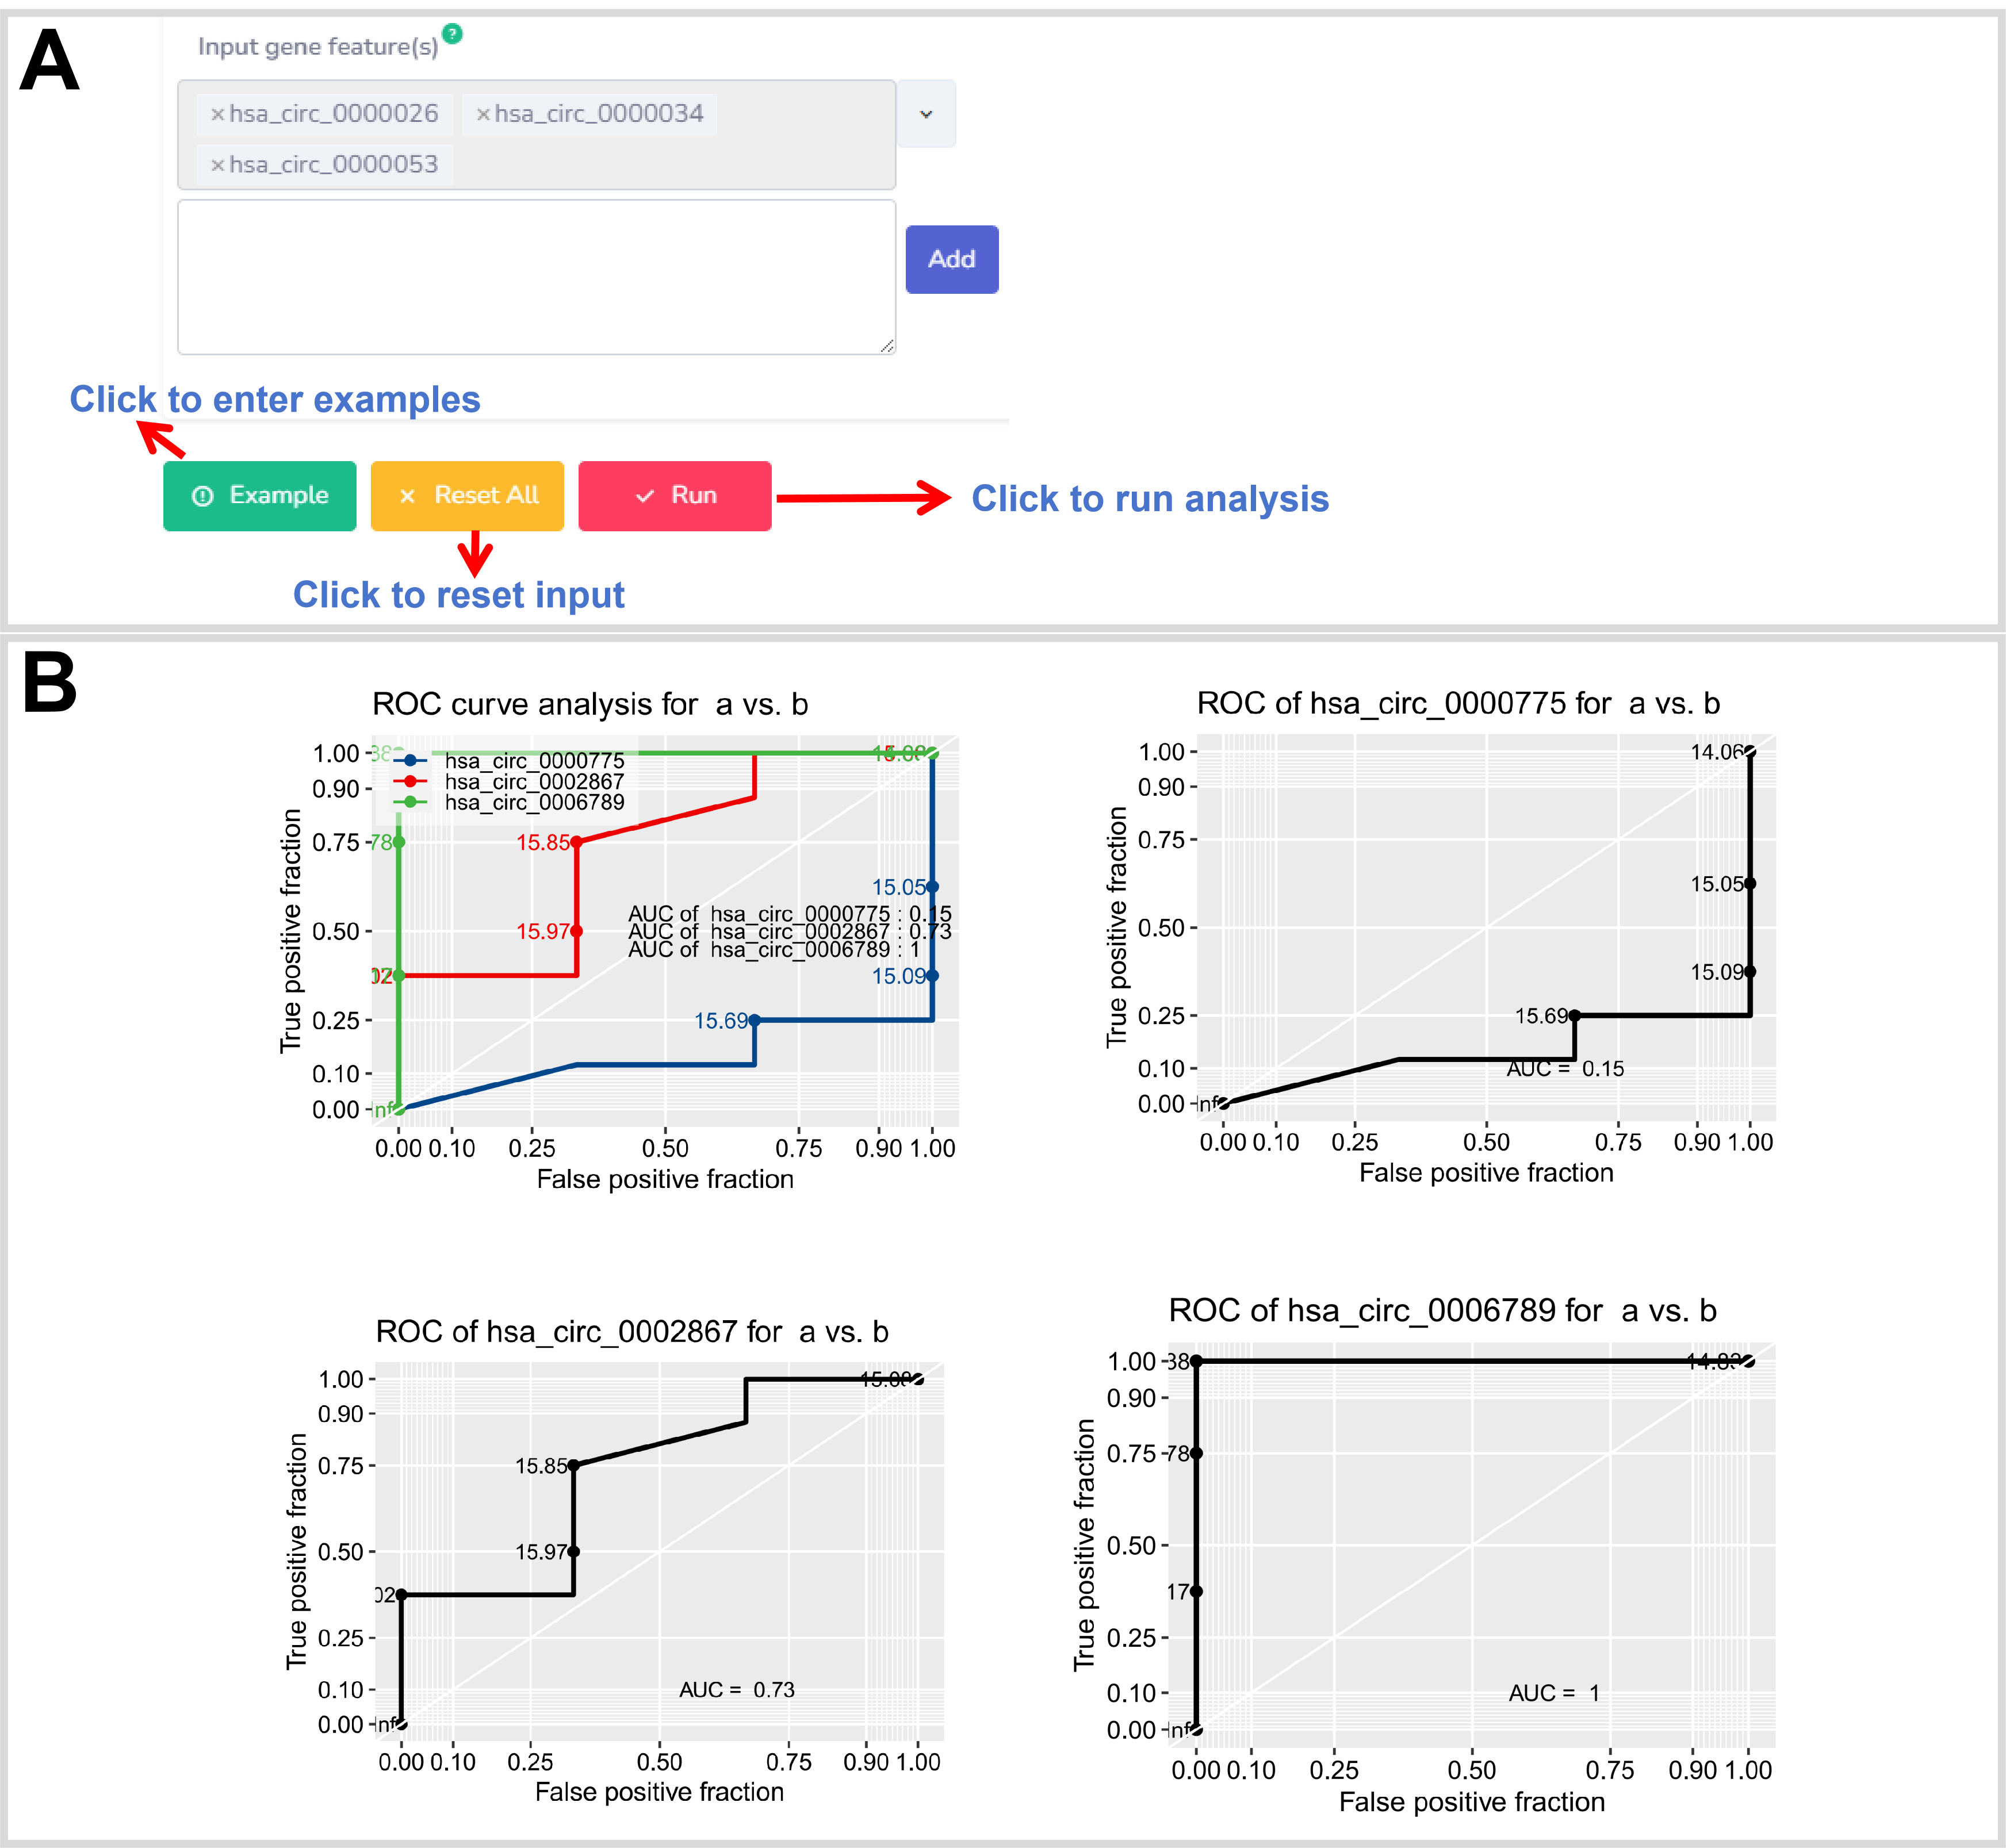
Figure 30. The web interface of the ROC.
8. CircRNA-miRNA prediction
To identify potential interaction between circRNA and miRNA, we established the CircRNA-miRNA prediction tool based on miRanda, miRBase, and circBase. The tool allows to enter a list of the circRNA IDs in circBase and the circRNA sequences in the FASTA format. In addition, this tool also encourages users to upload a text file, which contains a list of the circBase IDs or the circRNAs sequences in the FASTA format. Moreover, two parameters (score cutoff and energy cutoff) are provided to show the significant interacting miRNA. The prediction results are displayed in a table. A menu at the table header can be used to set columns and rows to show interesting information (Figure 20). The filter box allows to quick search. In addition, right click on the table body displays an instruction form to copy and export the table (Figure 20). Moreover, the miRBase IDs link to the miRBase resource for the detail information of the miRNAs.
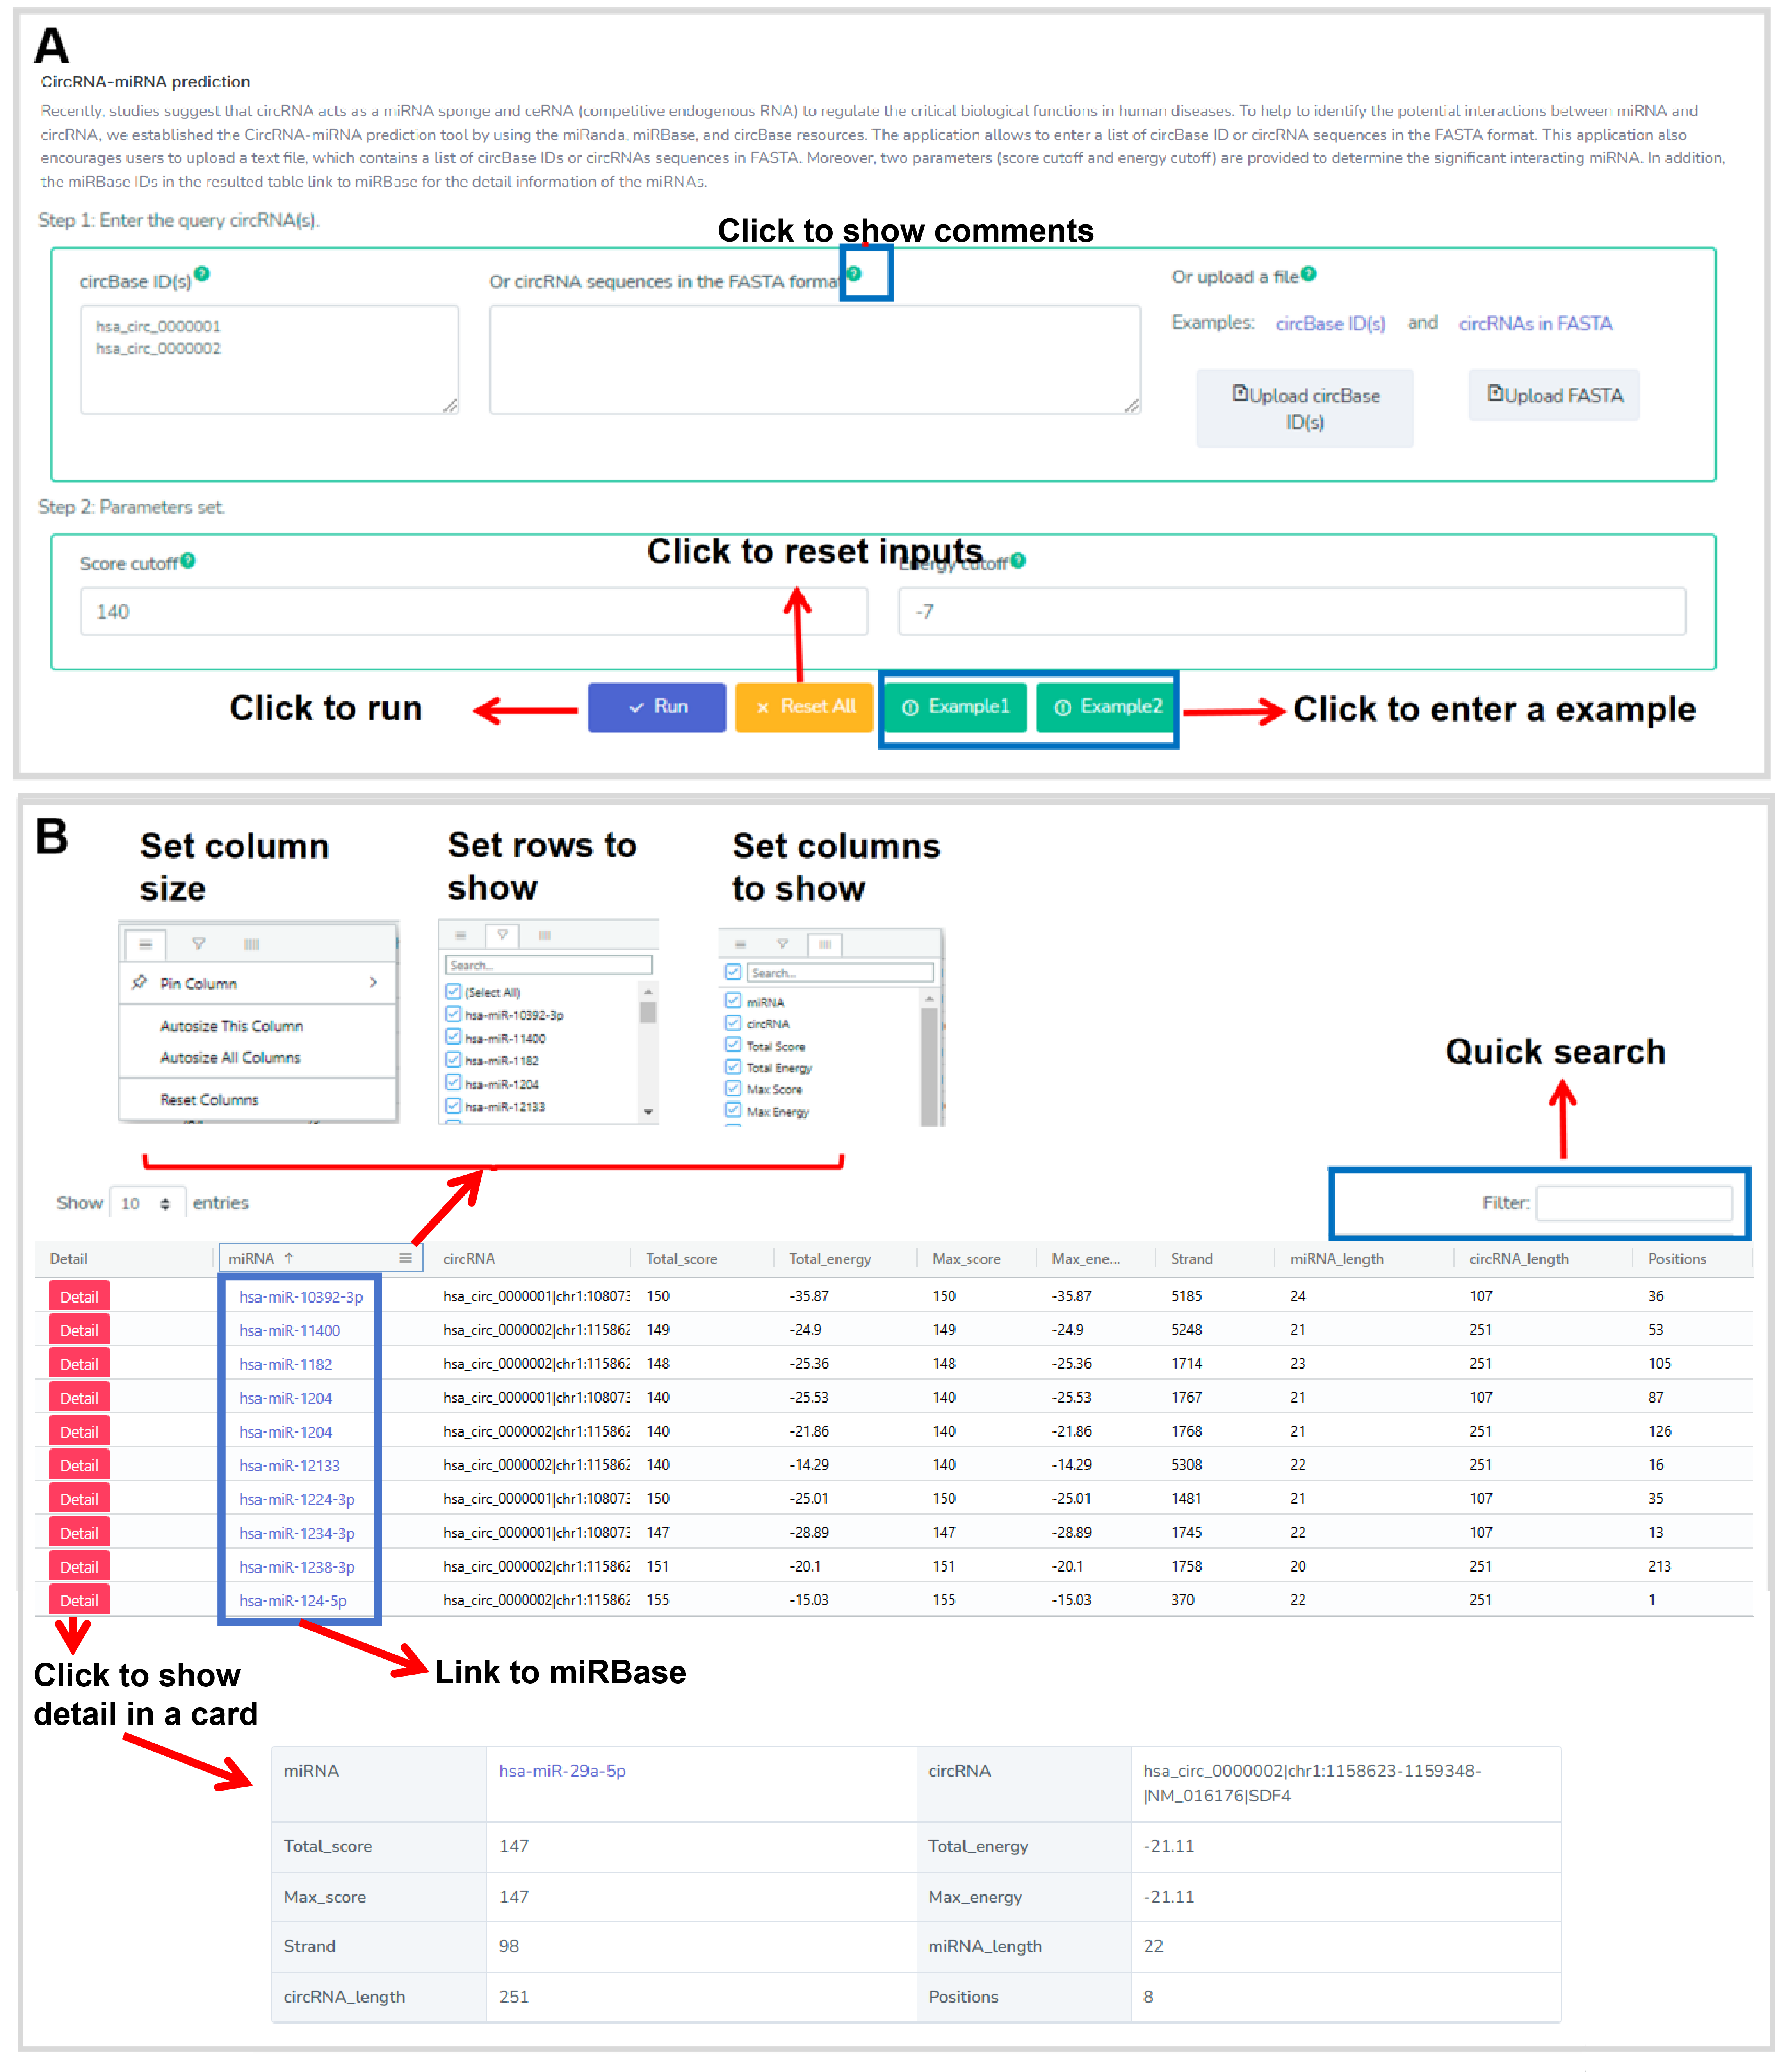
Figure 31. The web interface of the CircRNA-miRNA prediction.
9. CircRNA IRES prediction
Internal ribosome enter site elements (IRESs) in circRNA have be reported to drive its translation. Here, the CircRNA IRES prediction tool aims to identify experimentally validated human IRESs at circRNA based on the IRESs in IRESbase by using BLAST and circBase. The tool allows to enter a list of the circBase IDs or the circRNA sequences in the FASTA format, or upload a text file, which contains a list of the circBase IDs or the circRNA sequences in FASTA. In addition, a E-value cutoff parameter is provided to set a threshold for the significant IRES. The prediction results are displayed in a table. A menu at the table header can be used to set columns and rows to show interesting information (Figure 32). The filter box allows to quick search. In addition, right click on the table body displays an instruction form to copy and export the table (Figure 32). Moreover, the IRESbase IDs link to the IRESbase resource for the detail information of the IRESs. In addition, the button of "View Alignment Hit" can click to view the alignment hits between the circRNA and IRES.
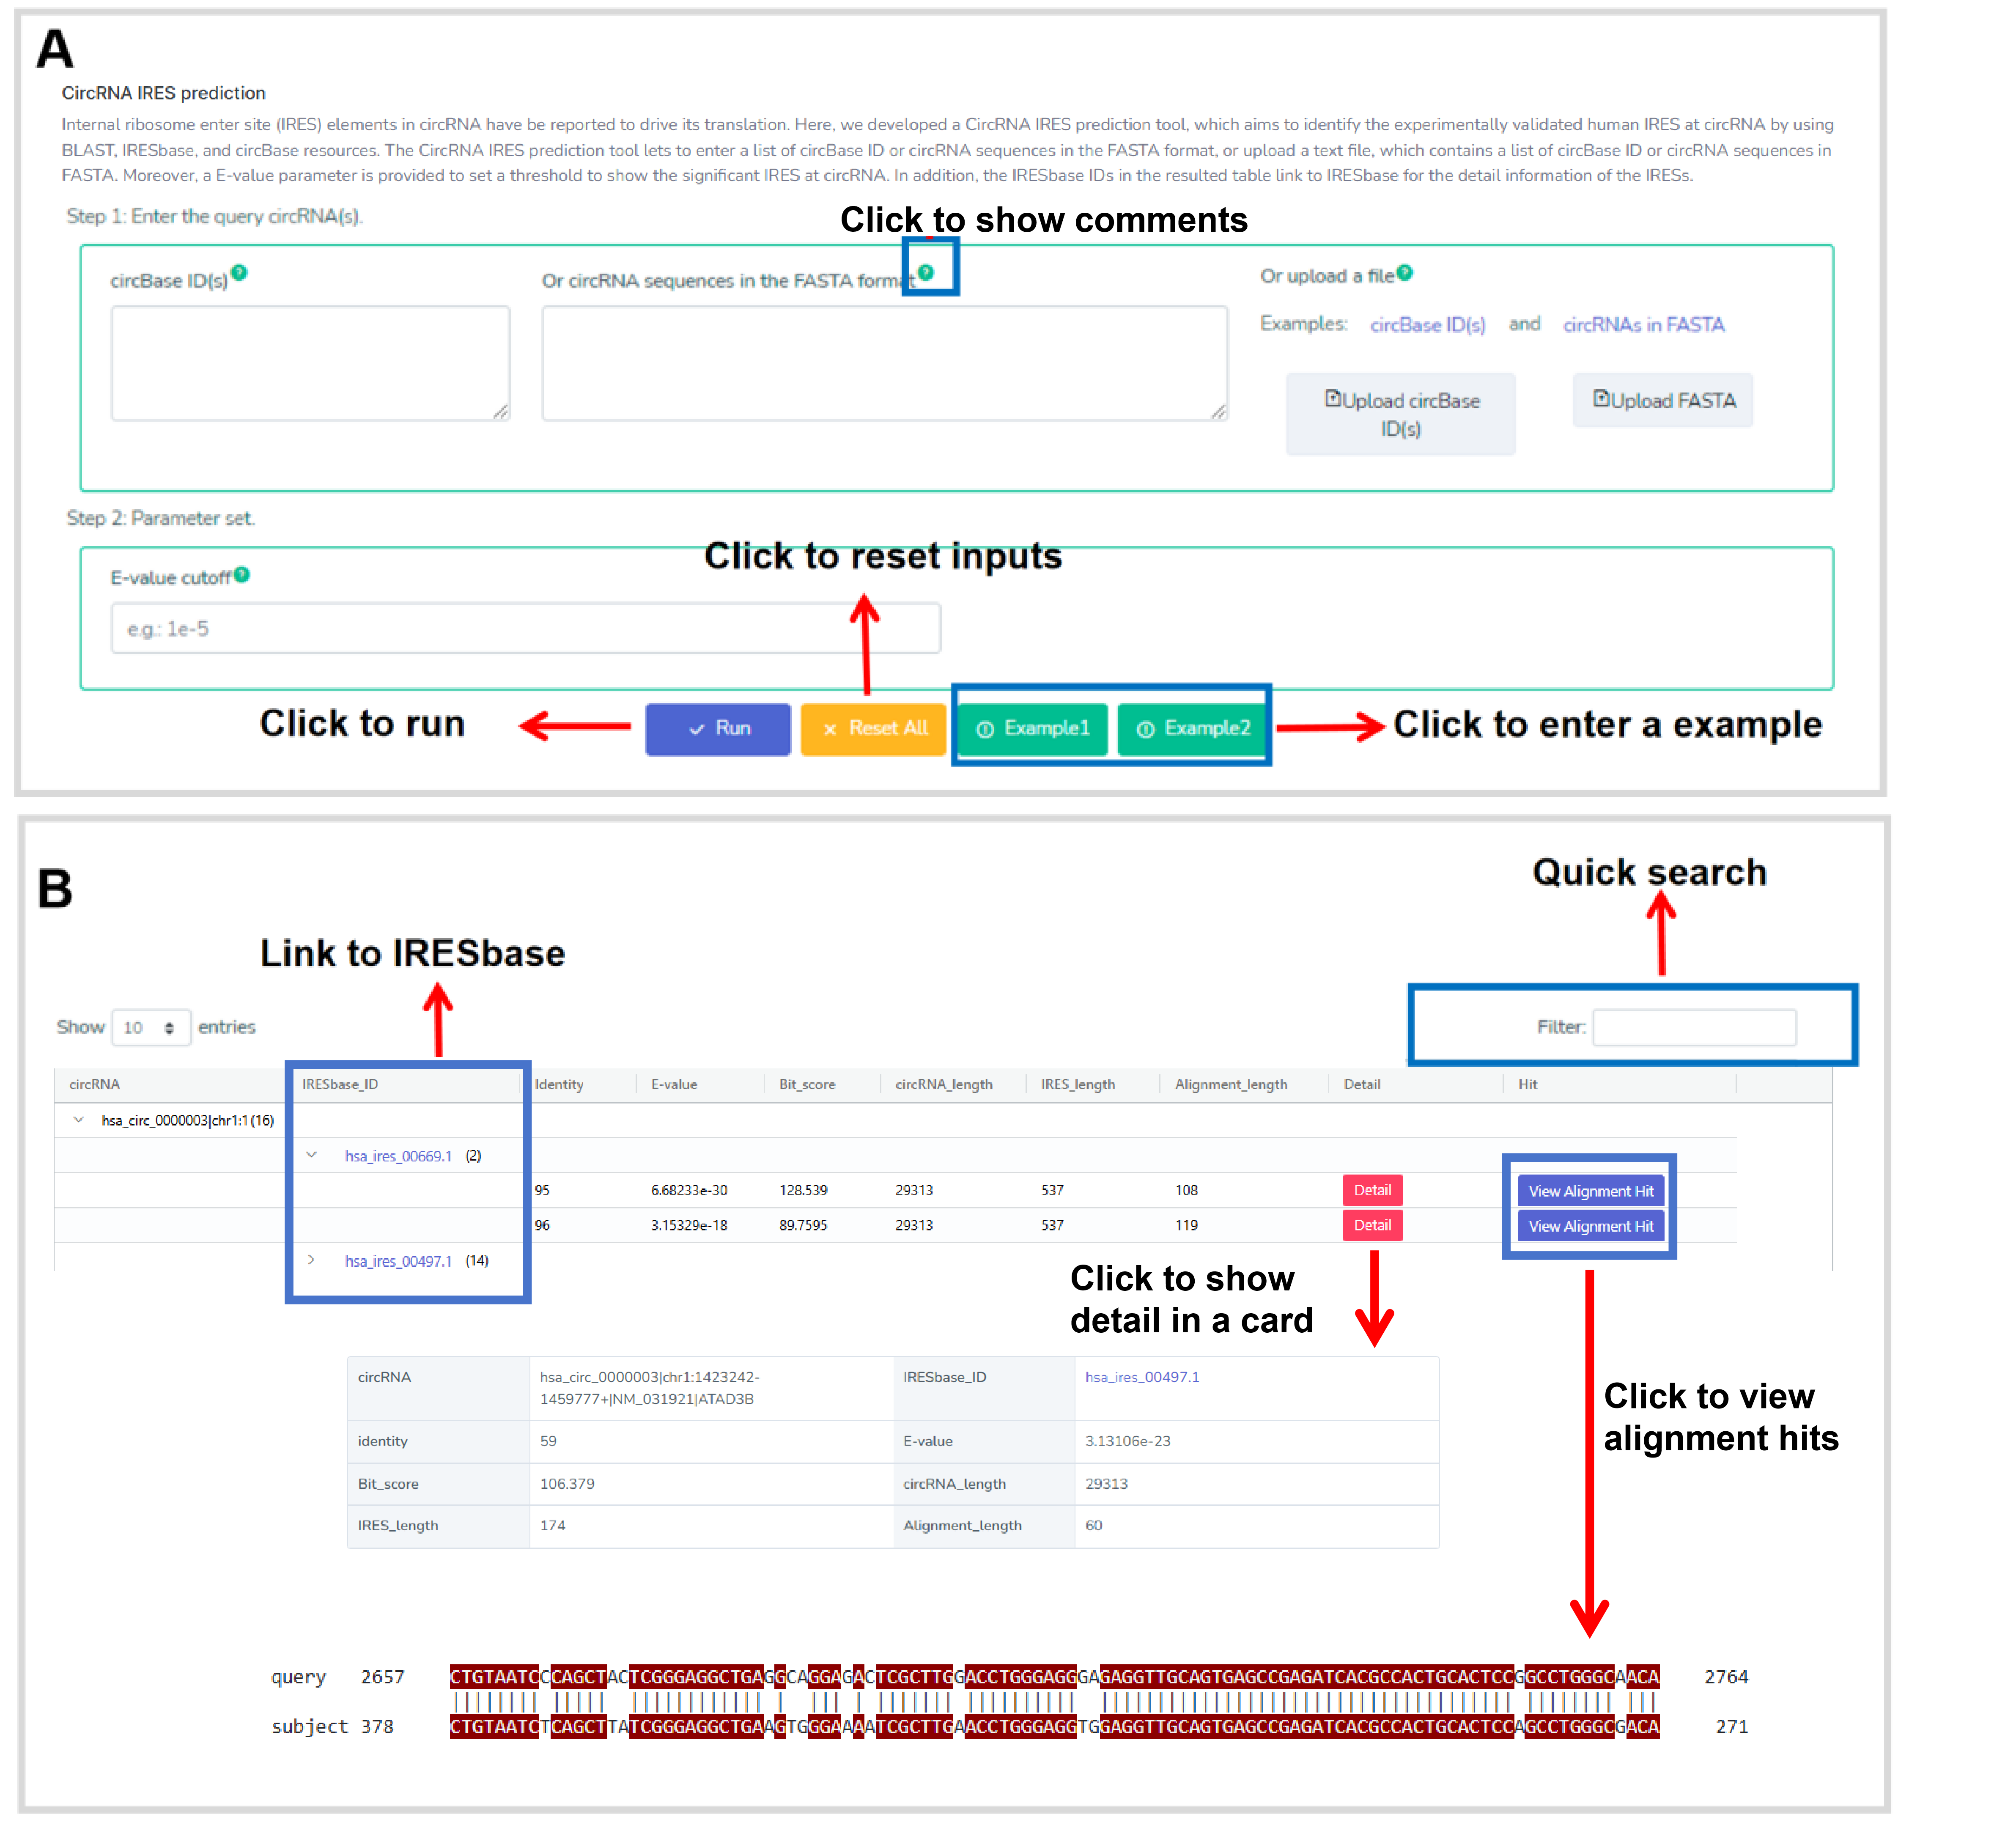
Figure 32. The web interface of the CircRNA IRES prediction.
10. CircRNA A-to-I annotation
CircRNA A-to-I annotation identifies A-to-I RNA editing sites located at circRNAs based on the CircAI database. Users are allowed to input circBase IDs or upload a file in this tool. Results are shown in a table including CircAI IDs, genomic positions (hg19), editing types, and editing frequencies. The table can be customized, and detailed information is available via the REDIportal_accession column (Figure 33).
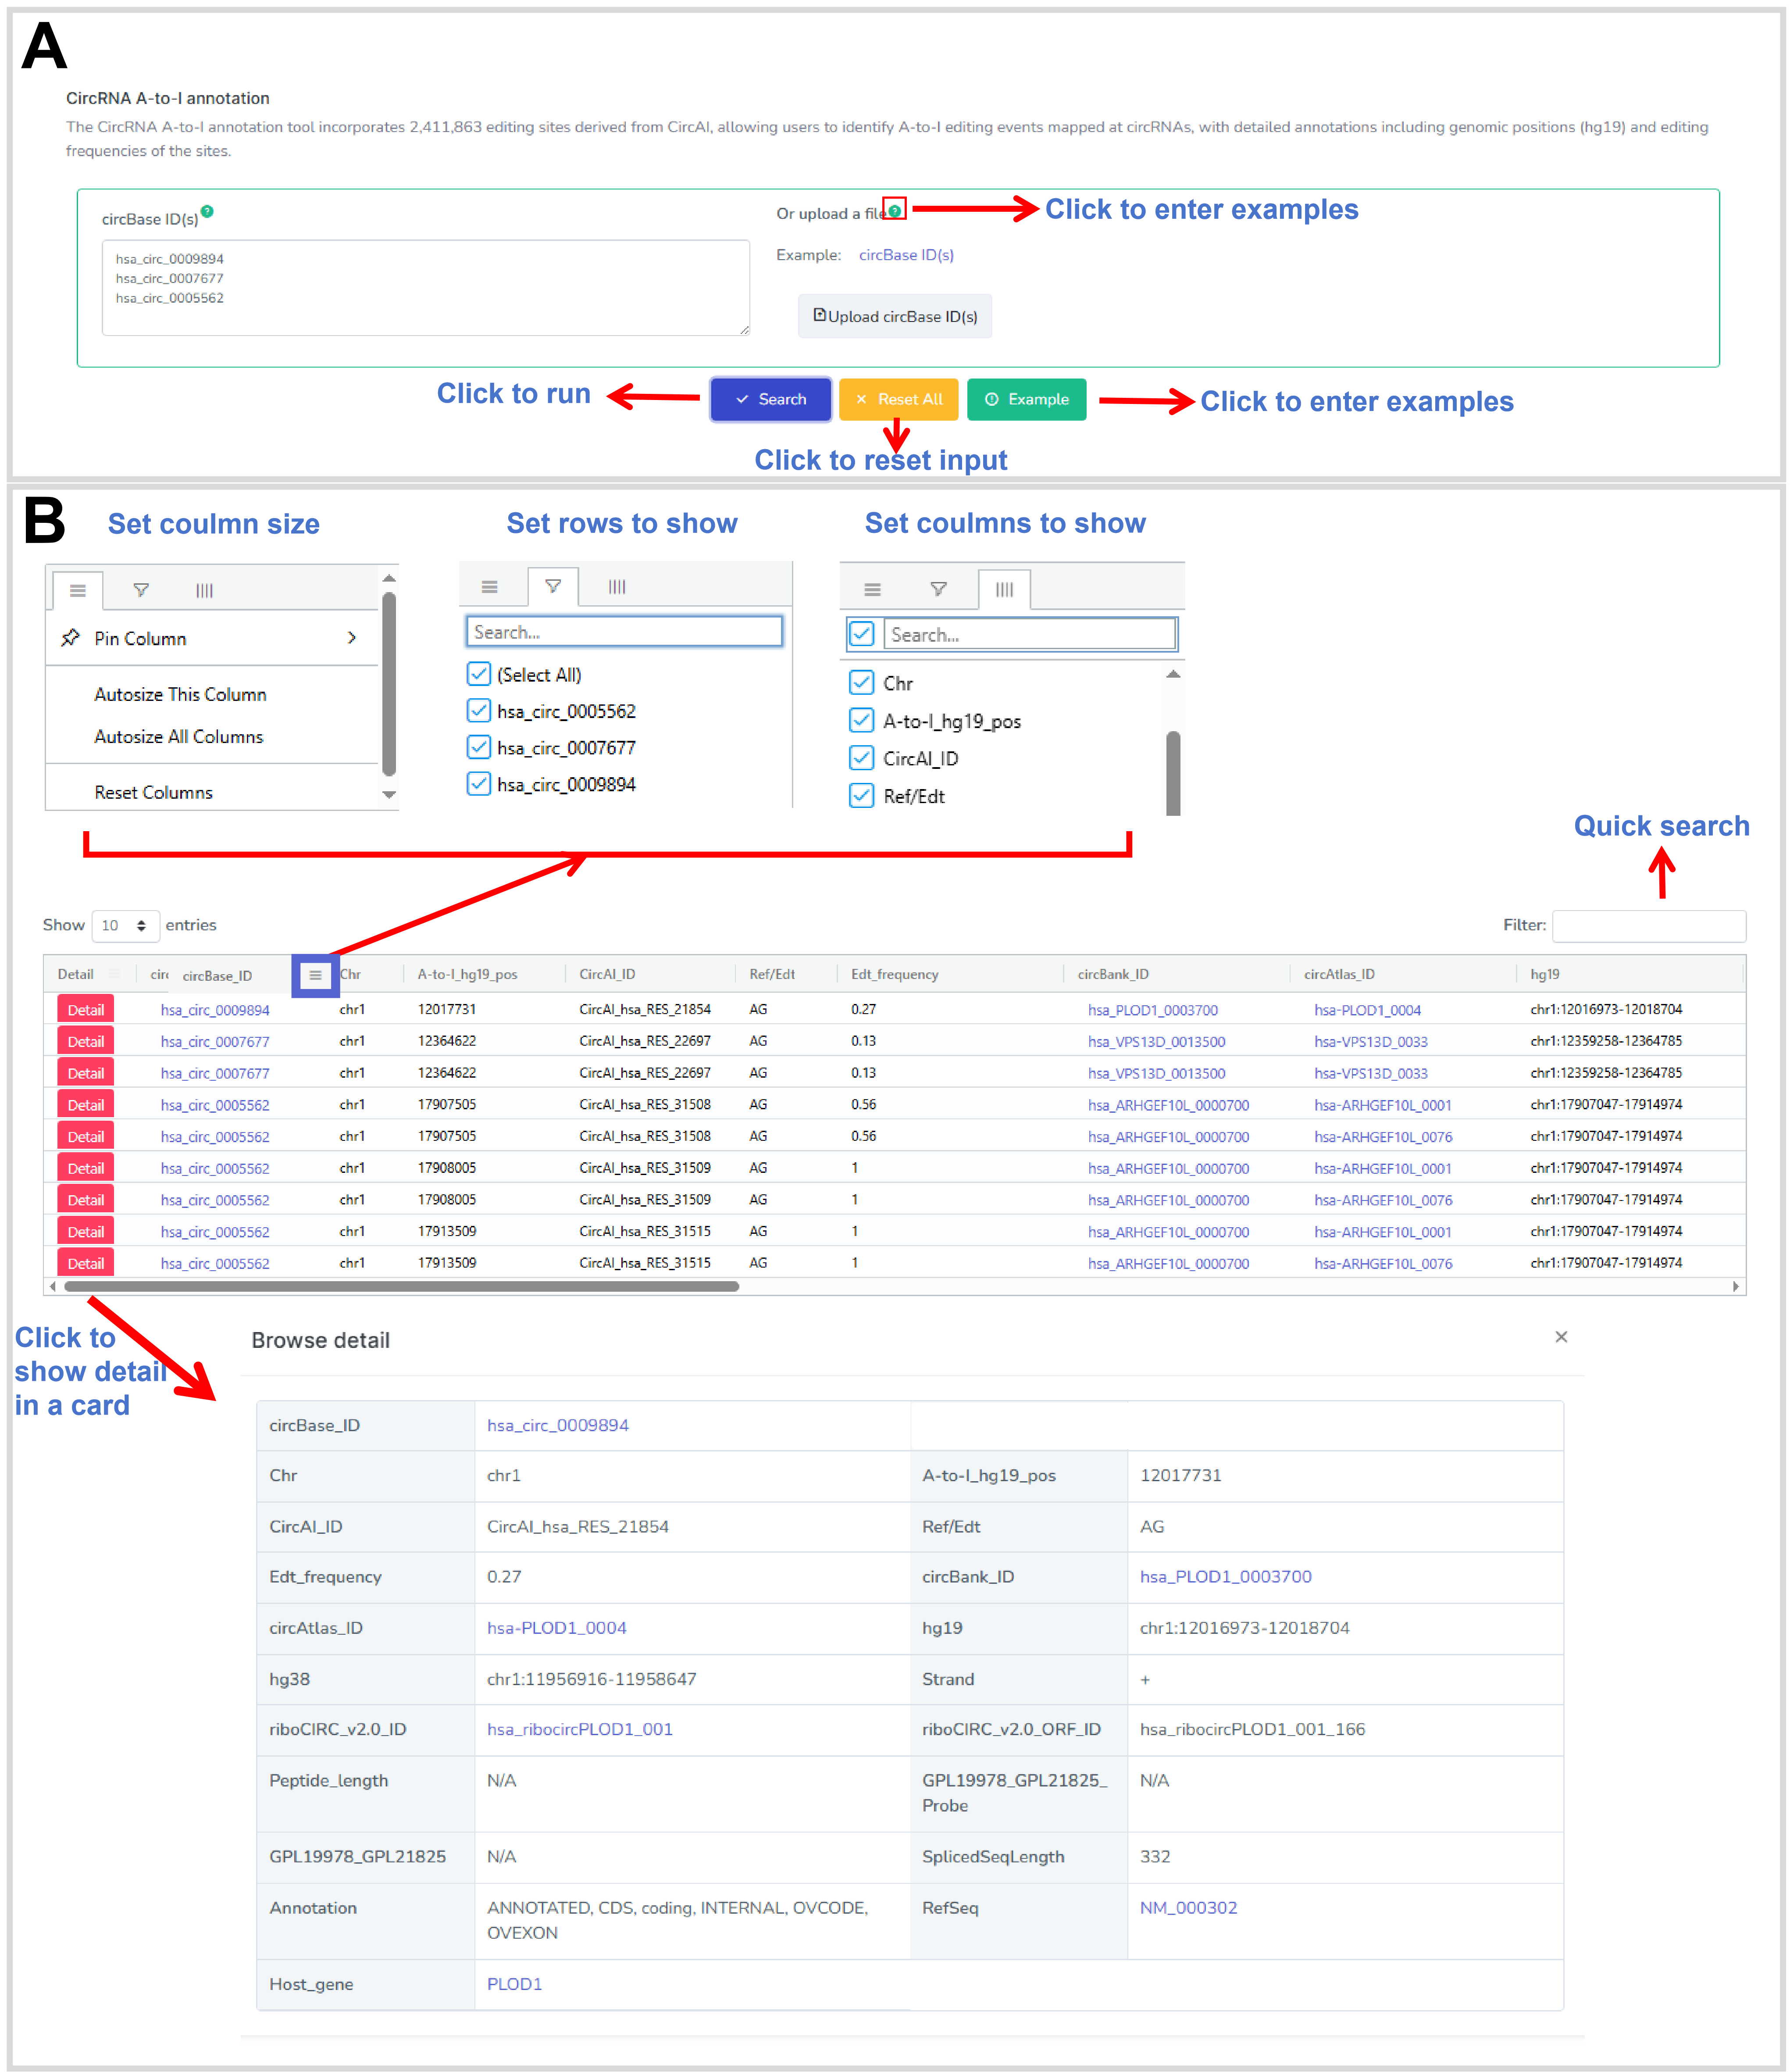
Figure 33. The web interface of the CircRNA A-to-I annotation.
11. CircRNA m6A annotation
CircRNA m6A annotation identifies m6A modification sites located at circRNAs based on the m6A2Circ database. Users are allowed to input circBase IDs or upload a file in this tool. Results are presented in a table including m6A2Circ IDs, associated sample types and tissues, and supporting evidences (Figure 34). The table can be customized, and detailed information is available via the m6A2CircID column.
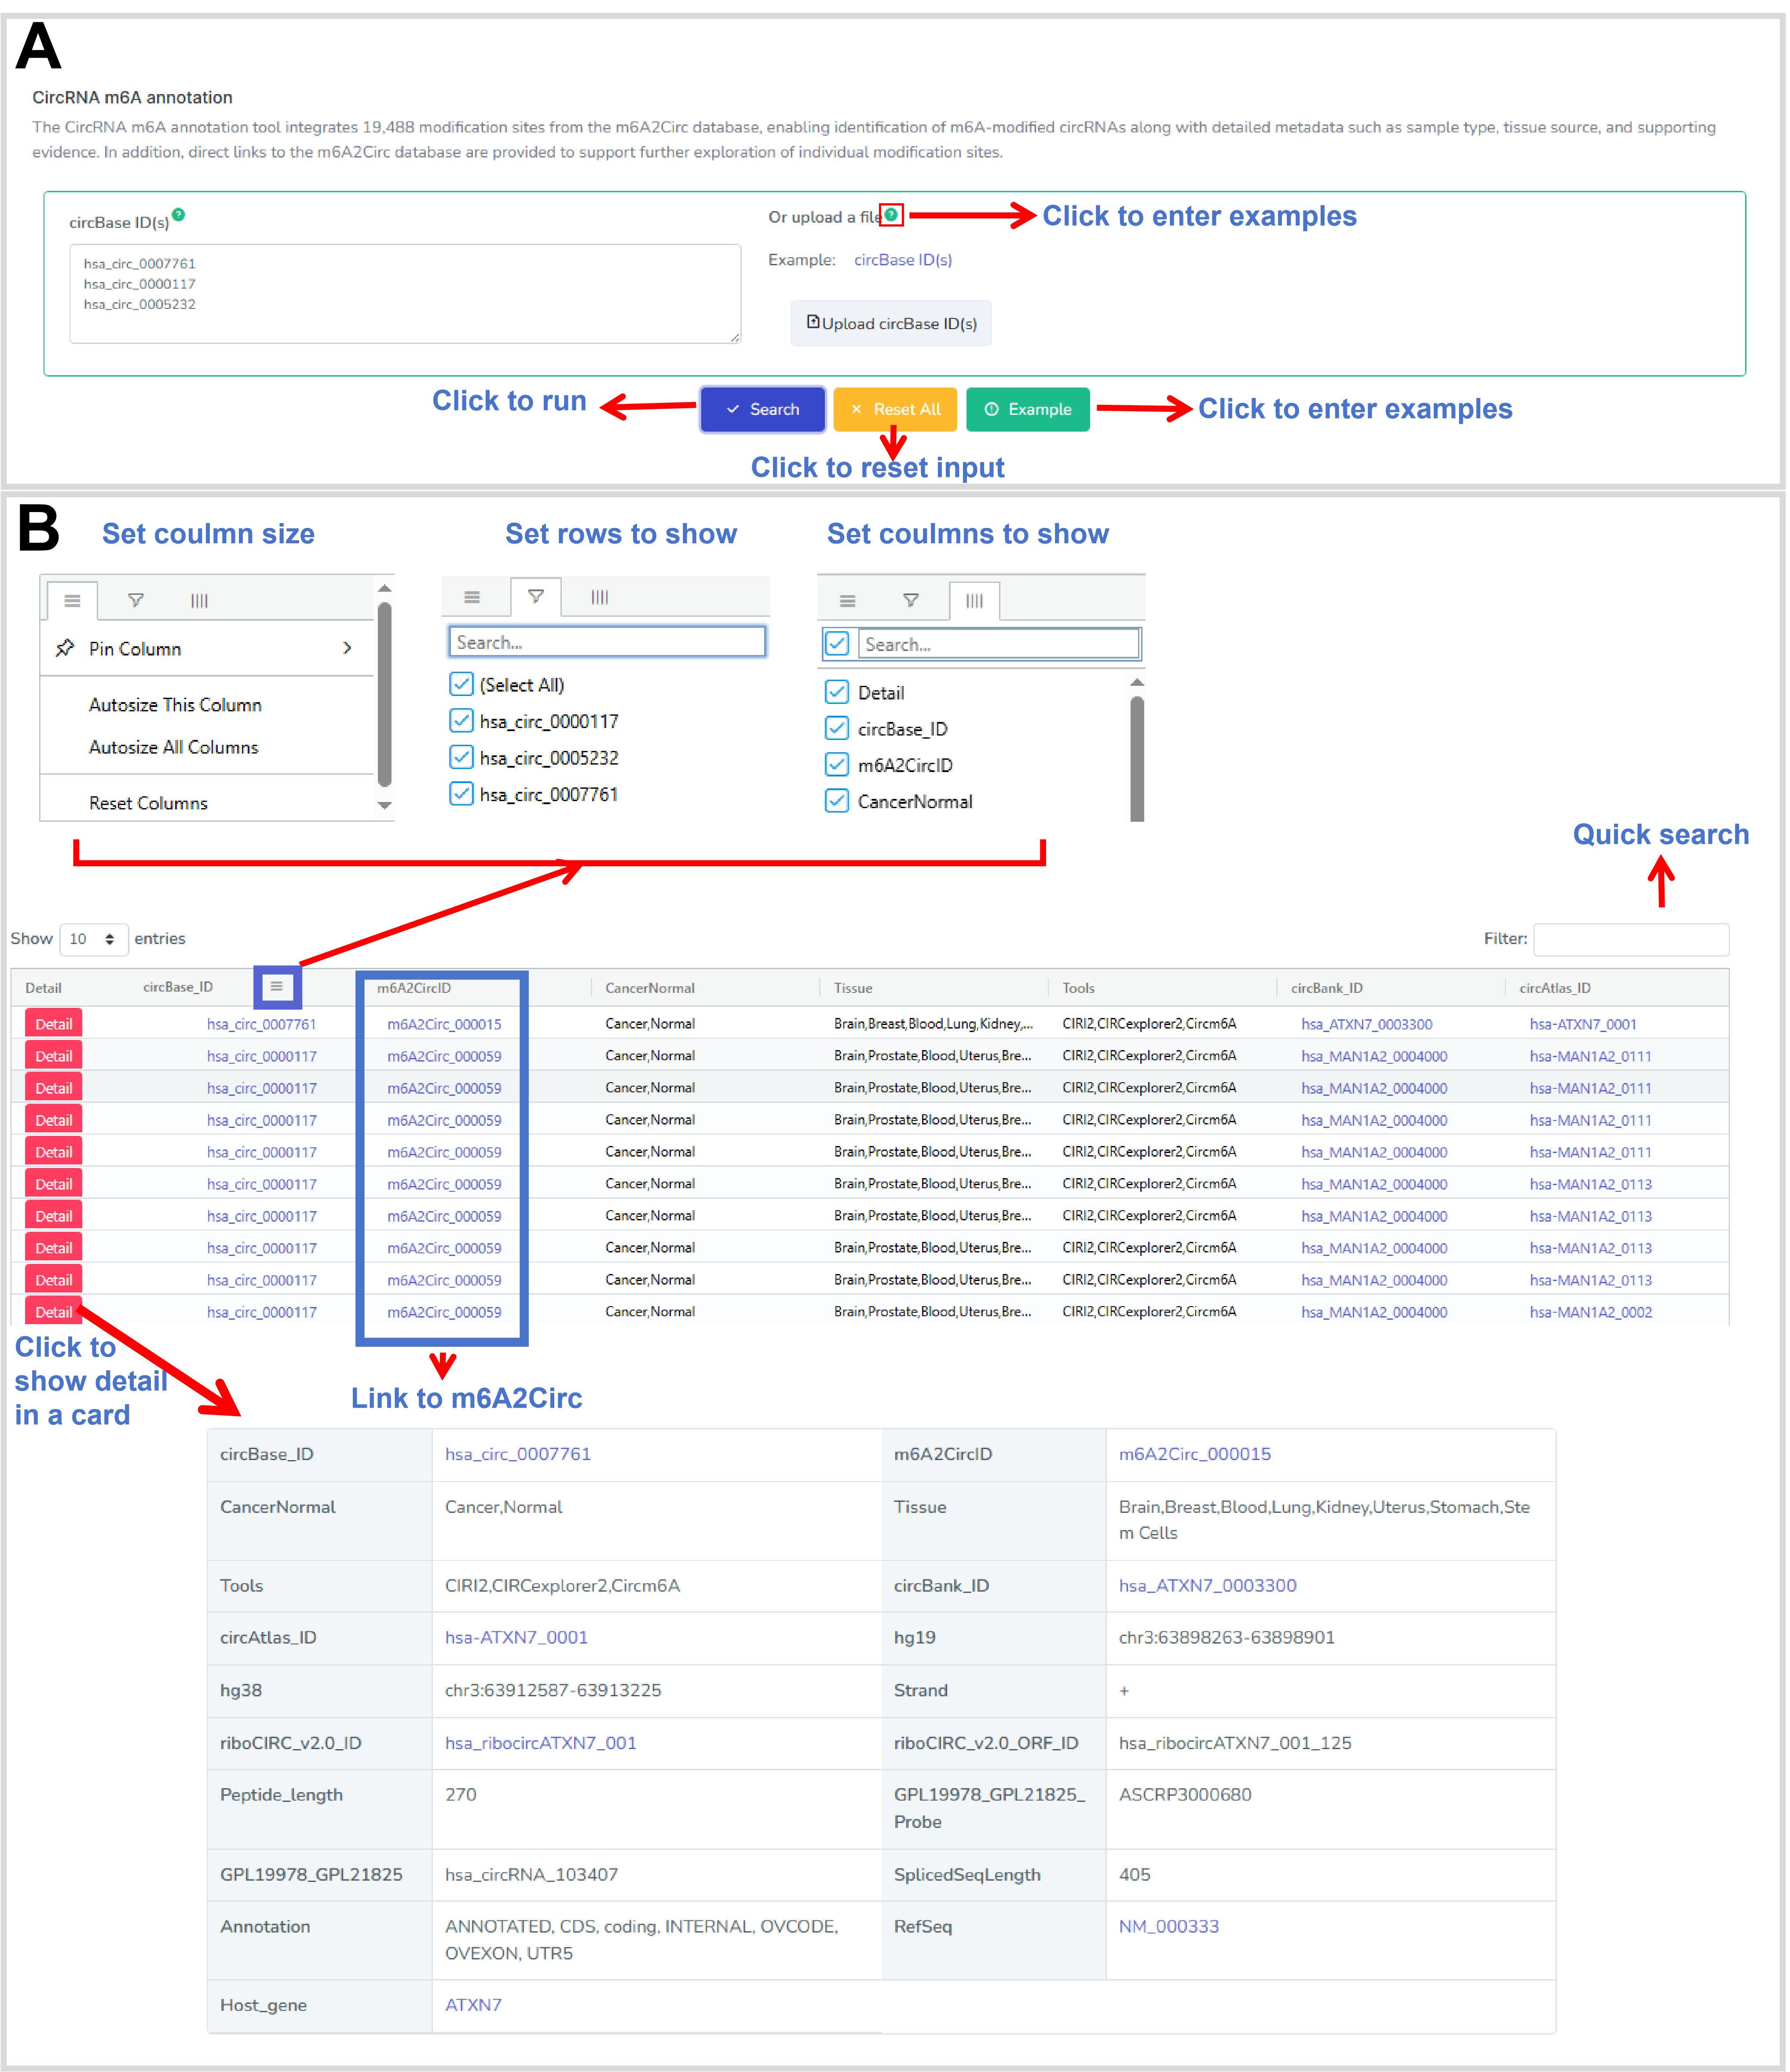
Figure 34. The web interface of the CircRNA m6A annotation.
12. CircRNA-RBP interaction
CircRNA-RBP interaction aims to show the sites of RNA-binding proteins (RBP) interacting with the circRNA (from CircInteractome database). Users are allowed to input circBase IDs or upload a file in this tool. Results are presented in a table including the tag, which refers to the overlapping CLIP-Seq reads mapped to the circRNA, circRNA alignment coordinates and RBP (Figure35).
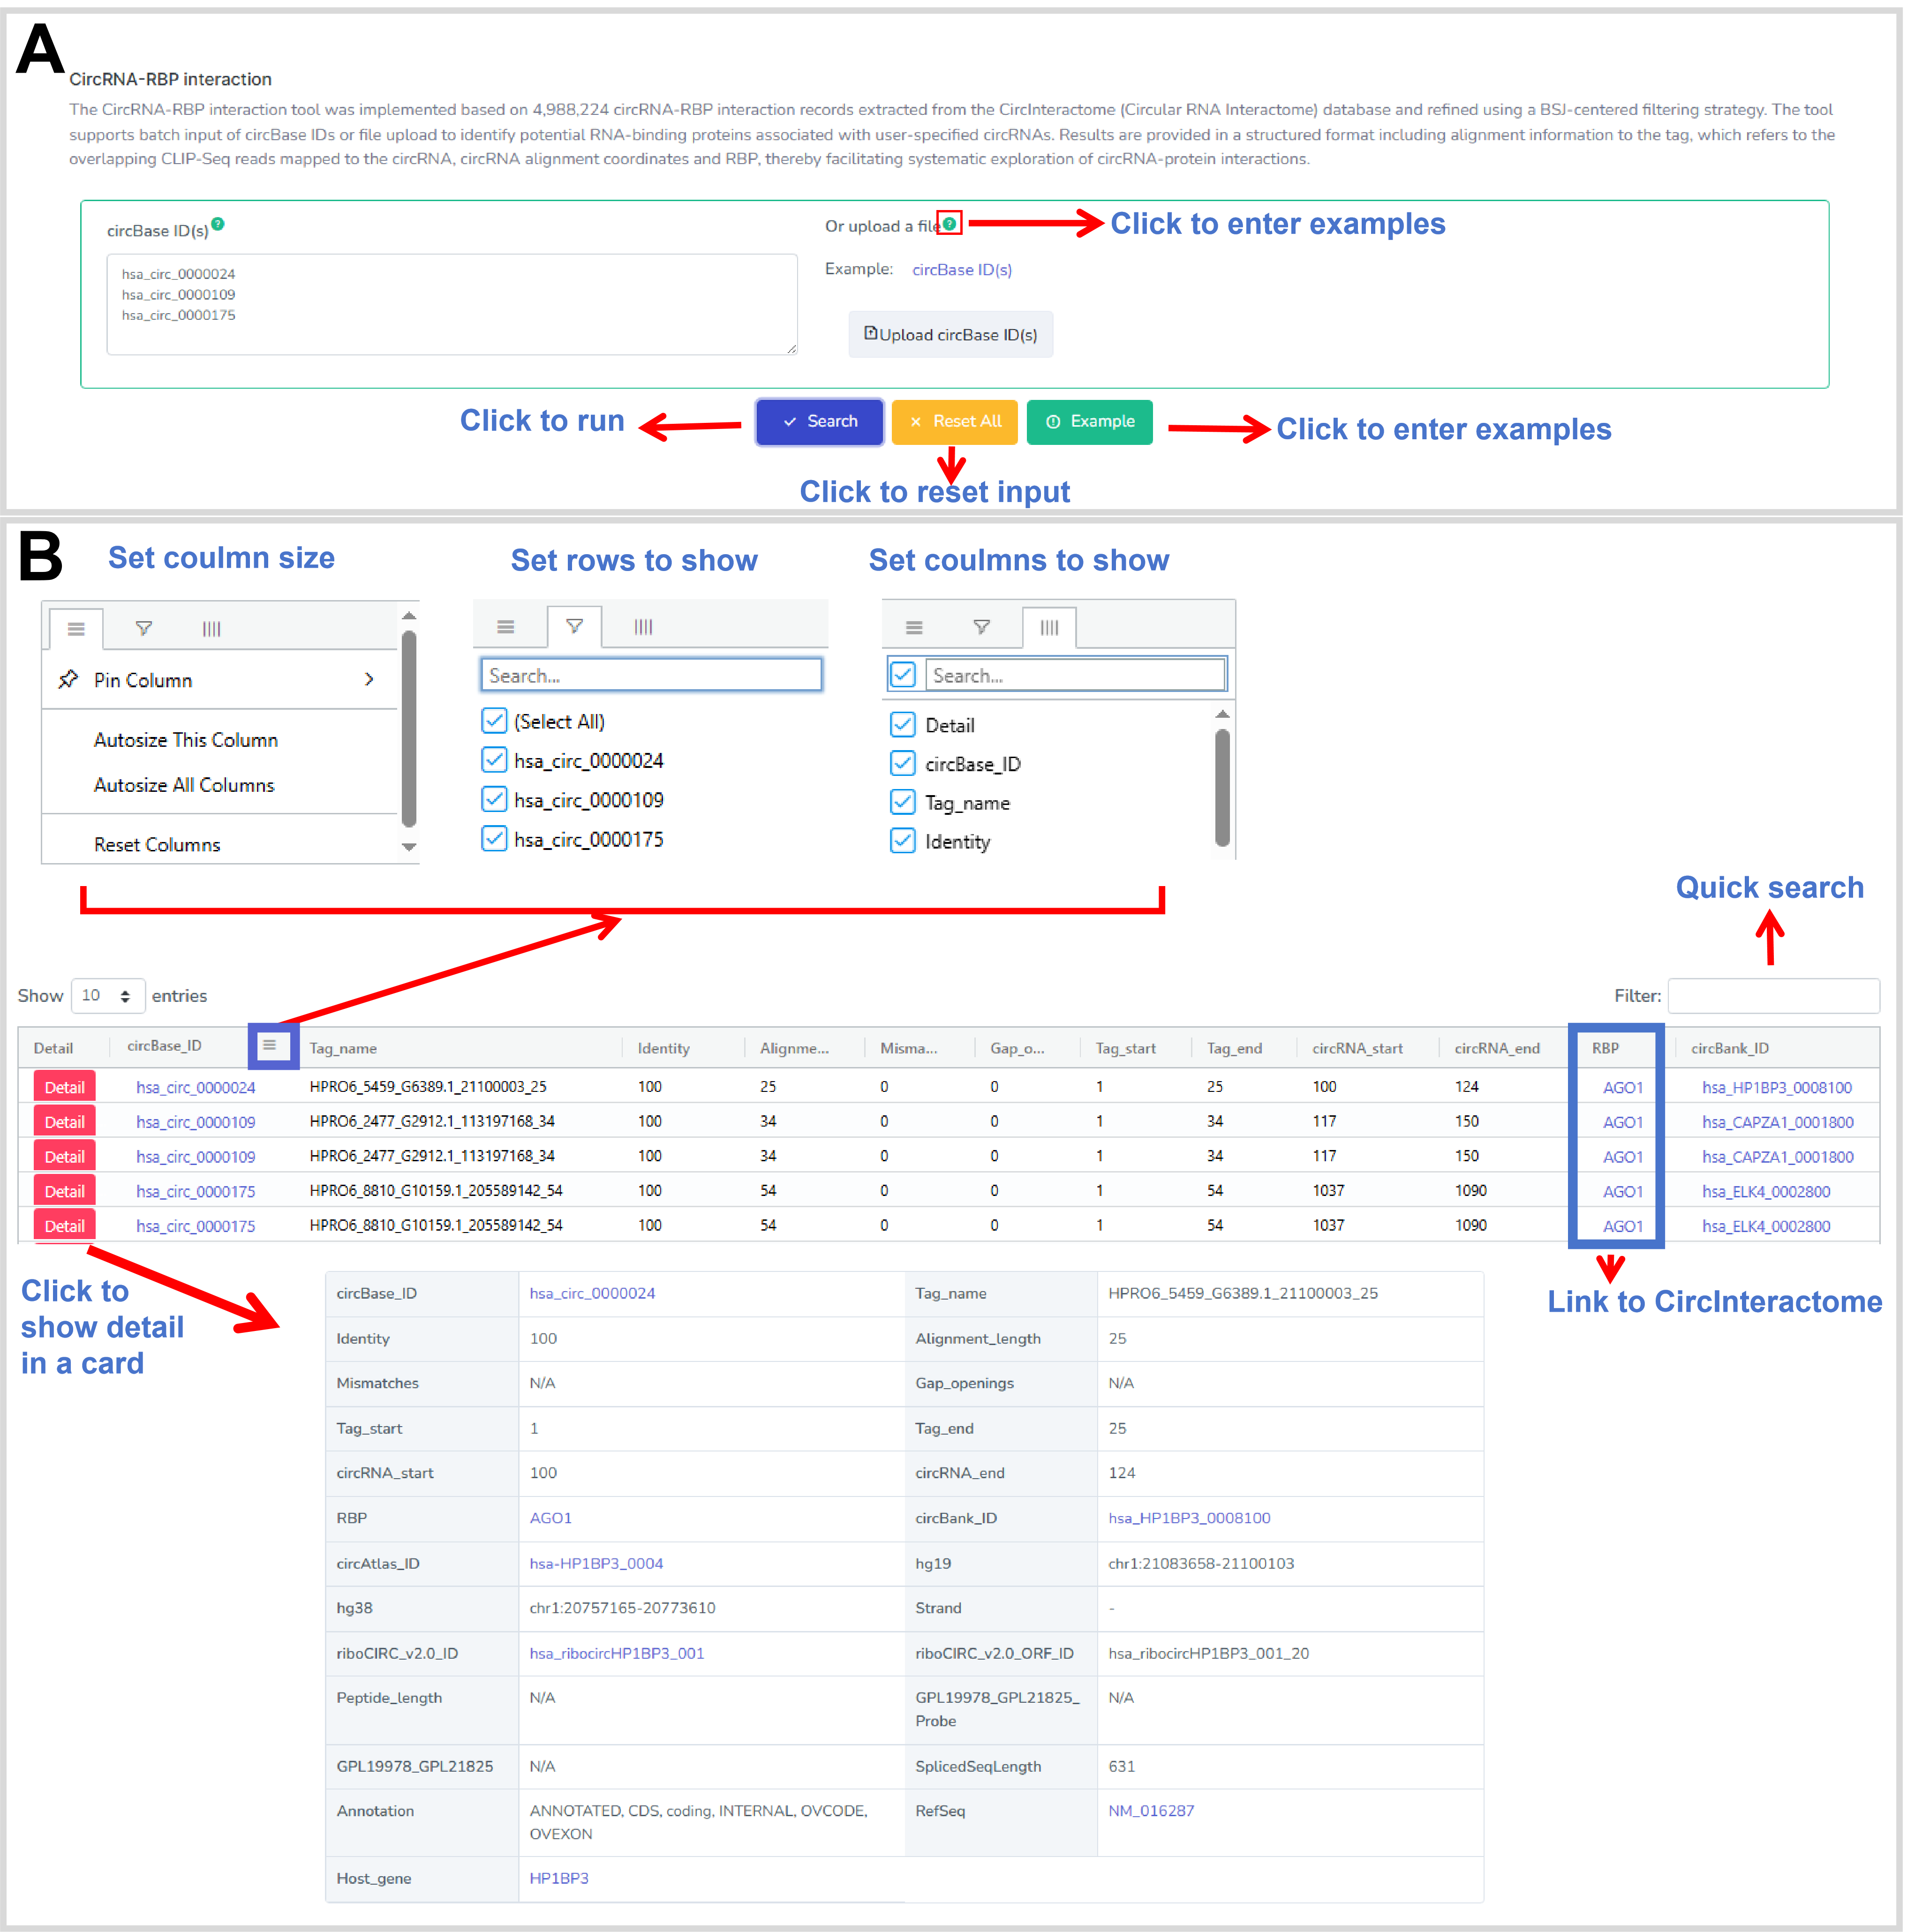
Figure 35. The web interface of the CircRNA-RBP interaction.
13. Translatable circRNA identification
The Translatable circRNA identification aims to find ribosome associated circRNA (ribo-circRNA) and predict the subcellular localization of the potential peptides or proteins translated by its. The tool allows users to enter multiple circRNAs, which can be named as circBase_ID, circBank_ID, RefSeq ID, hg19 and hg38 position, circRNA host gene, and circRNA ID or probe of the GPL19978/GPL21825 platform in GEO. The results are displayed in a table. A menu at the table header can be used to set columns and rows to show interesting information (Figure 36). The filter box allows to quick search. In addition, right clicking on the table body displays an instruction form to copy and export the table (Figure 36). Moreover, we also provided links to navigate to the public resources for the detail information of the circRNA and its peptides and proteins. In addition, the ribo-circRNA location tool allows 2 bp mismatch for the imputs of circRNA coordinates.
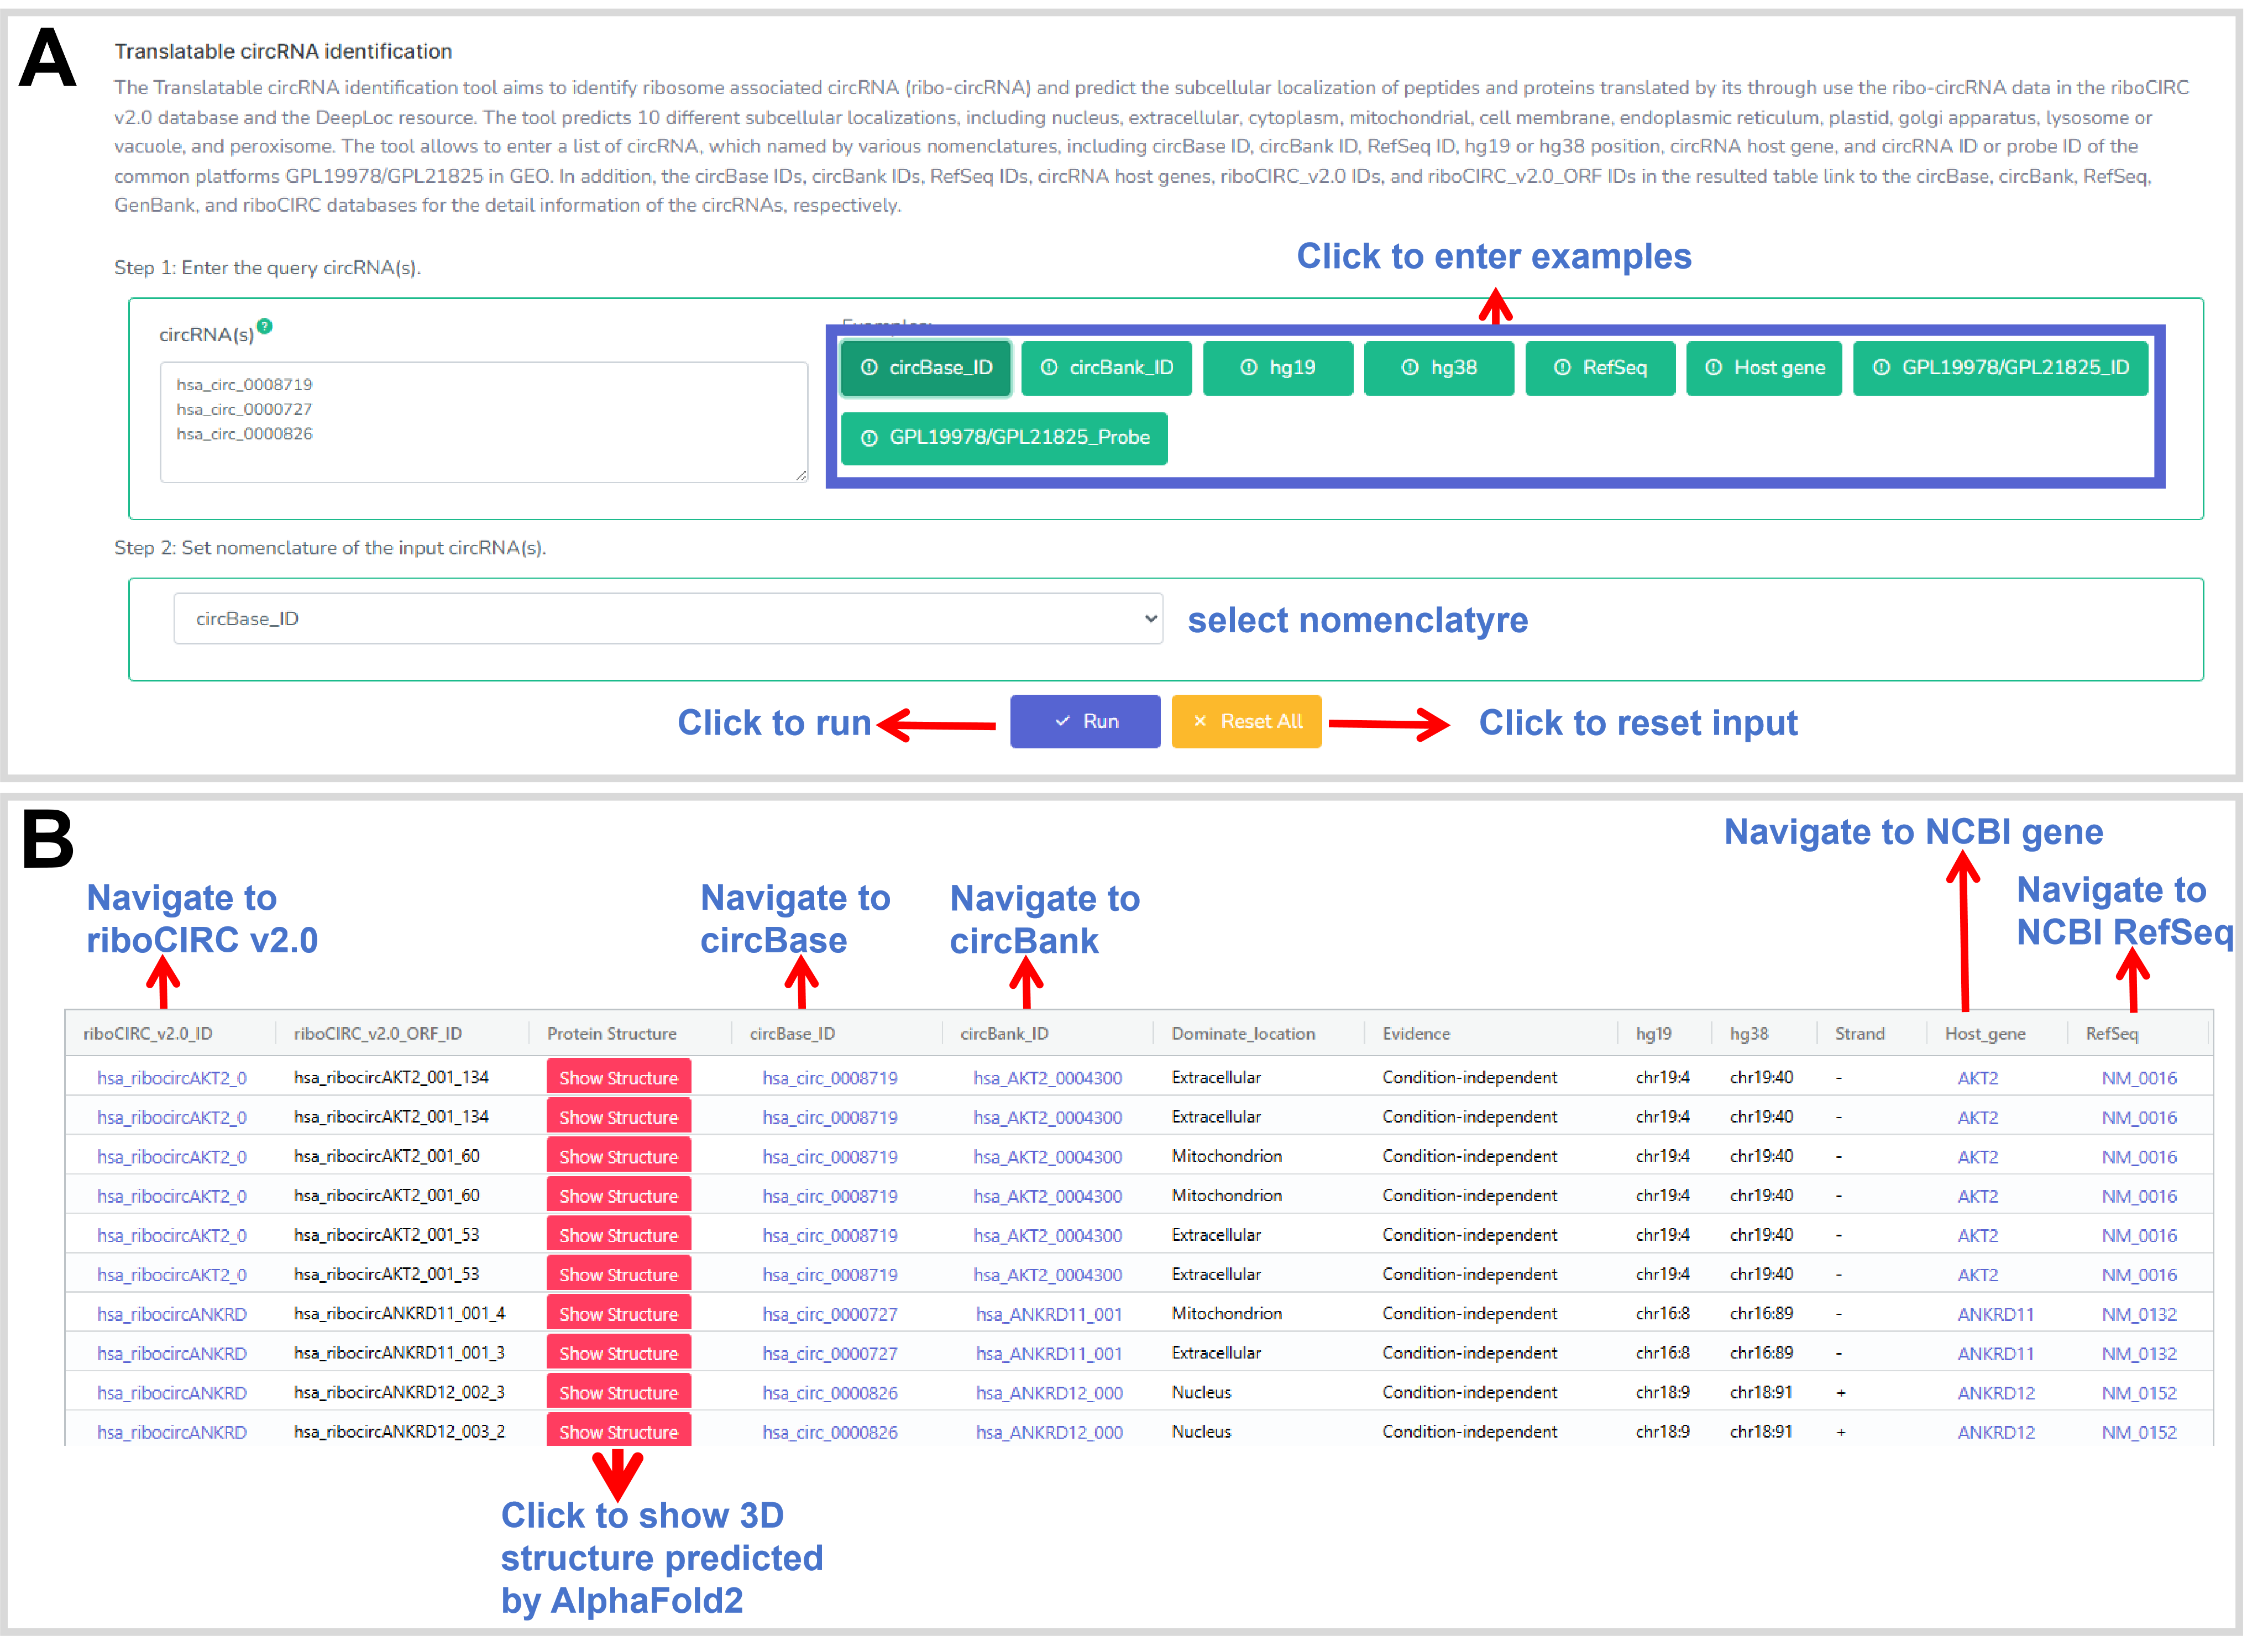
Figure 36. The web interface of the Translatable circRNA identification.
14. CircRNA name convert
Taking into account the different nomenclatures used for circRNA in different resources and platforms, we have developed a CircRNA name convert tool to achieve the annotations and the mutual conversion of circRNA identifiers among different resources and reference genomes, such as circBase_ID, circBank_ID, riboCIRC_v2.0_ID, RefSeq, Host gene, hg19, hg38, and the common platforms of GPL19978 and GPL21825 in GEO. The results are displayed in a table. A menu at the table header can be used to set columns and rows to show interesting information (Figure 37). The filter box allows to quick search. In addition, right clicking on the table body displays an instruction form to copy and export the table (Figure 37). Moreover, we also provided links to navigate to the public resources for the detail information of the circRNAs. In addition, the CircRNA name convert tool allows 2 bp mismatch for circRNA coordinates conversion.
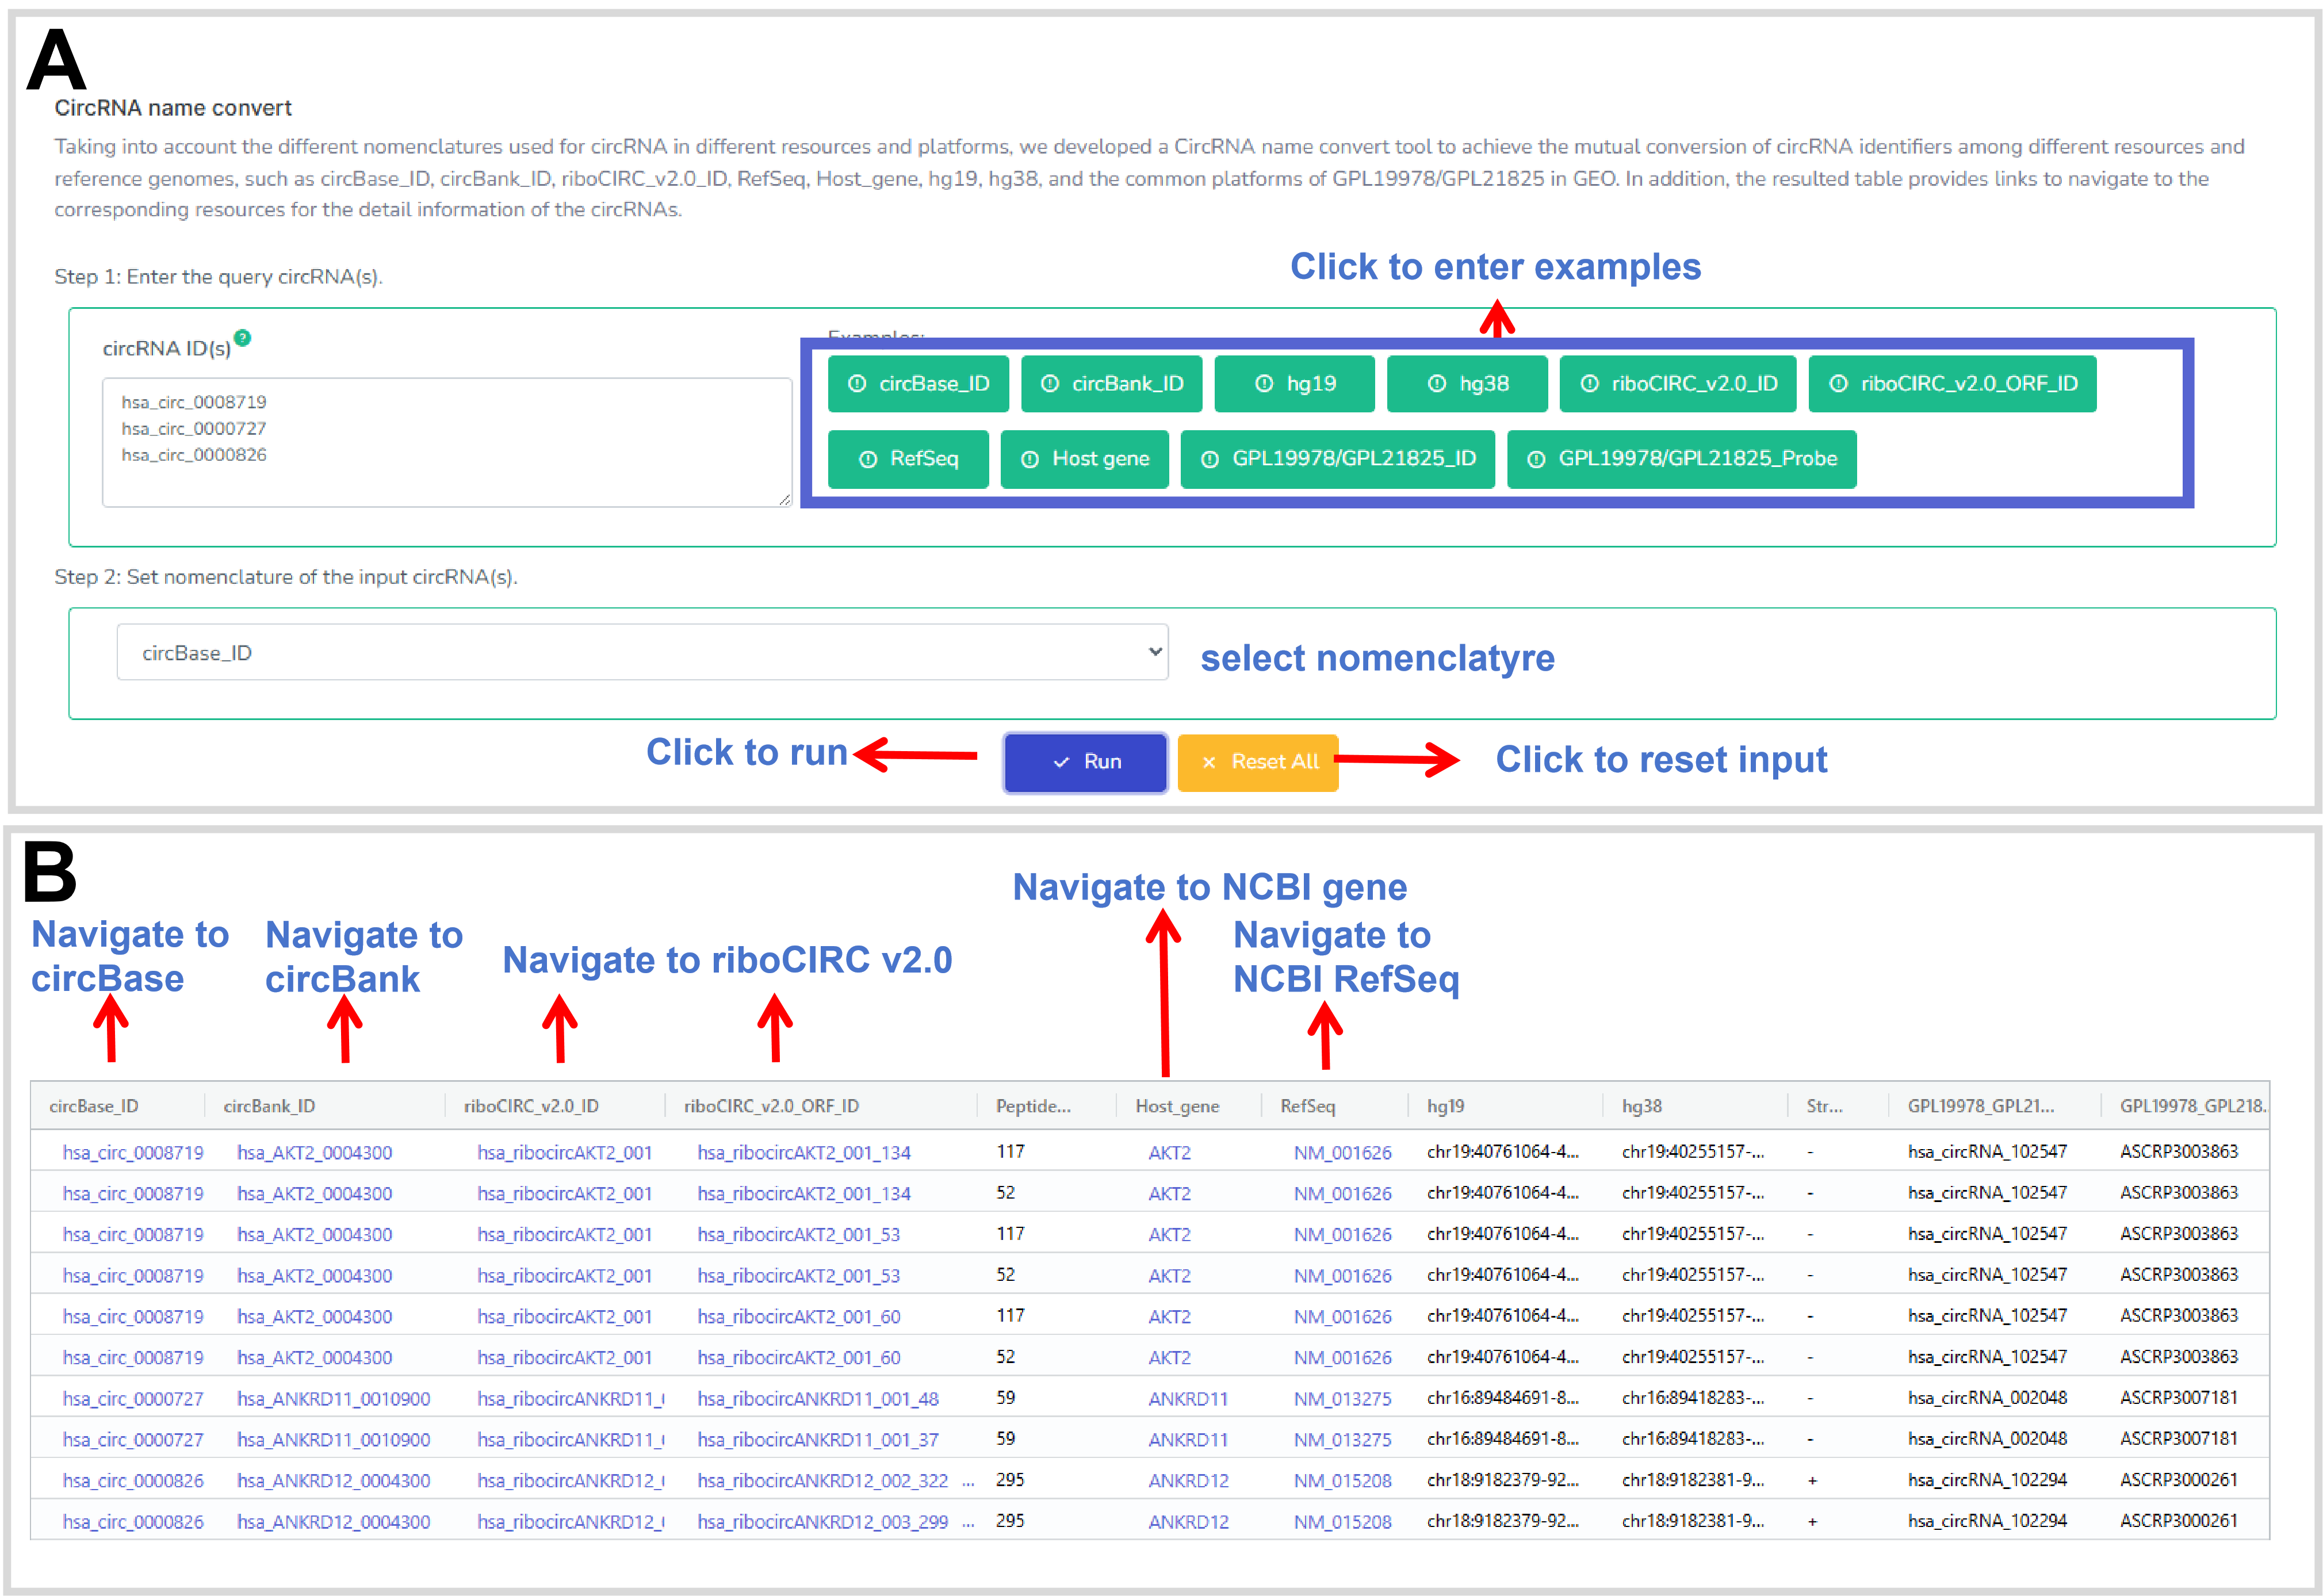
Figure 37. The web interface of the CircRNA name convert.
15. CeRNA network
The circRNA-centered network module comprises eight analytical functions designed to investigate
circRNA regulatory relationships with the mRNA/lncRNA genes and miRNAs. It
supports the construction of circRNA-centered interaction networks, correlation analyses, and
GO/KEGG-based functional enrichment of circRNA-associated mRNAs/lncRNAs/miRNAs to facilitate
circRNA functional inference under specific physiological and pathological conditions. The
module includes
Overview,
Correlation,
BoxPlot,
CorrPlot,
CircosPlot,
NetworkPlot,
GO, and
KEGG (Figure 38).
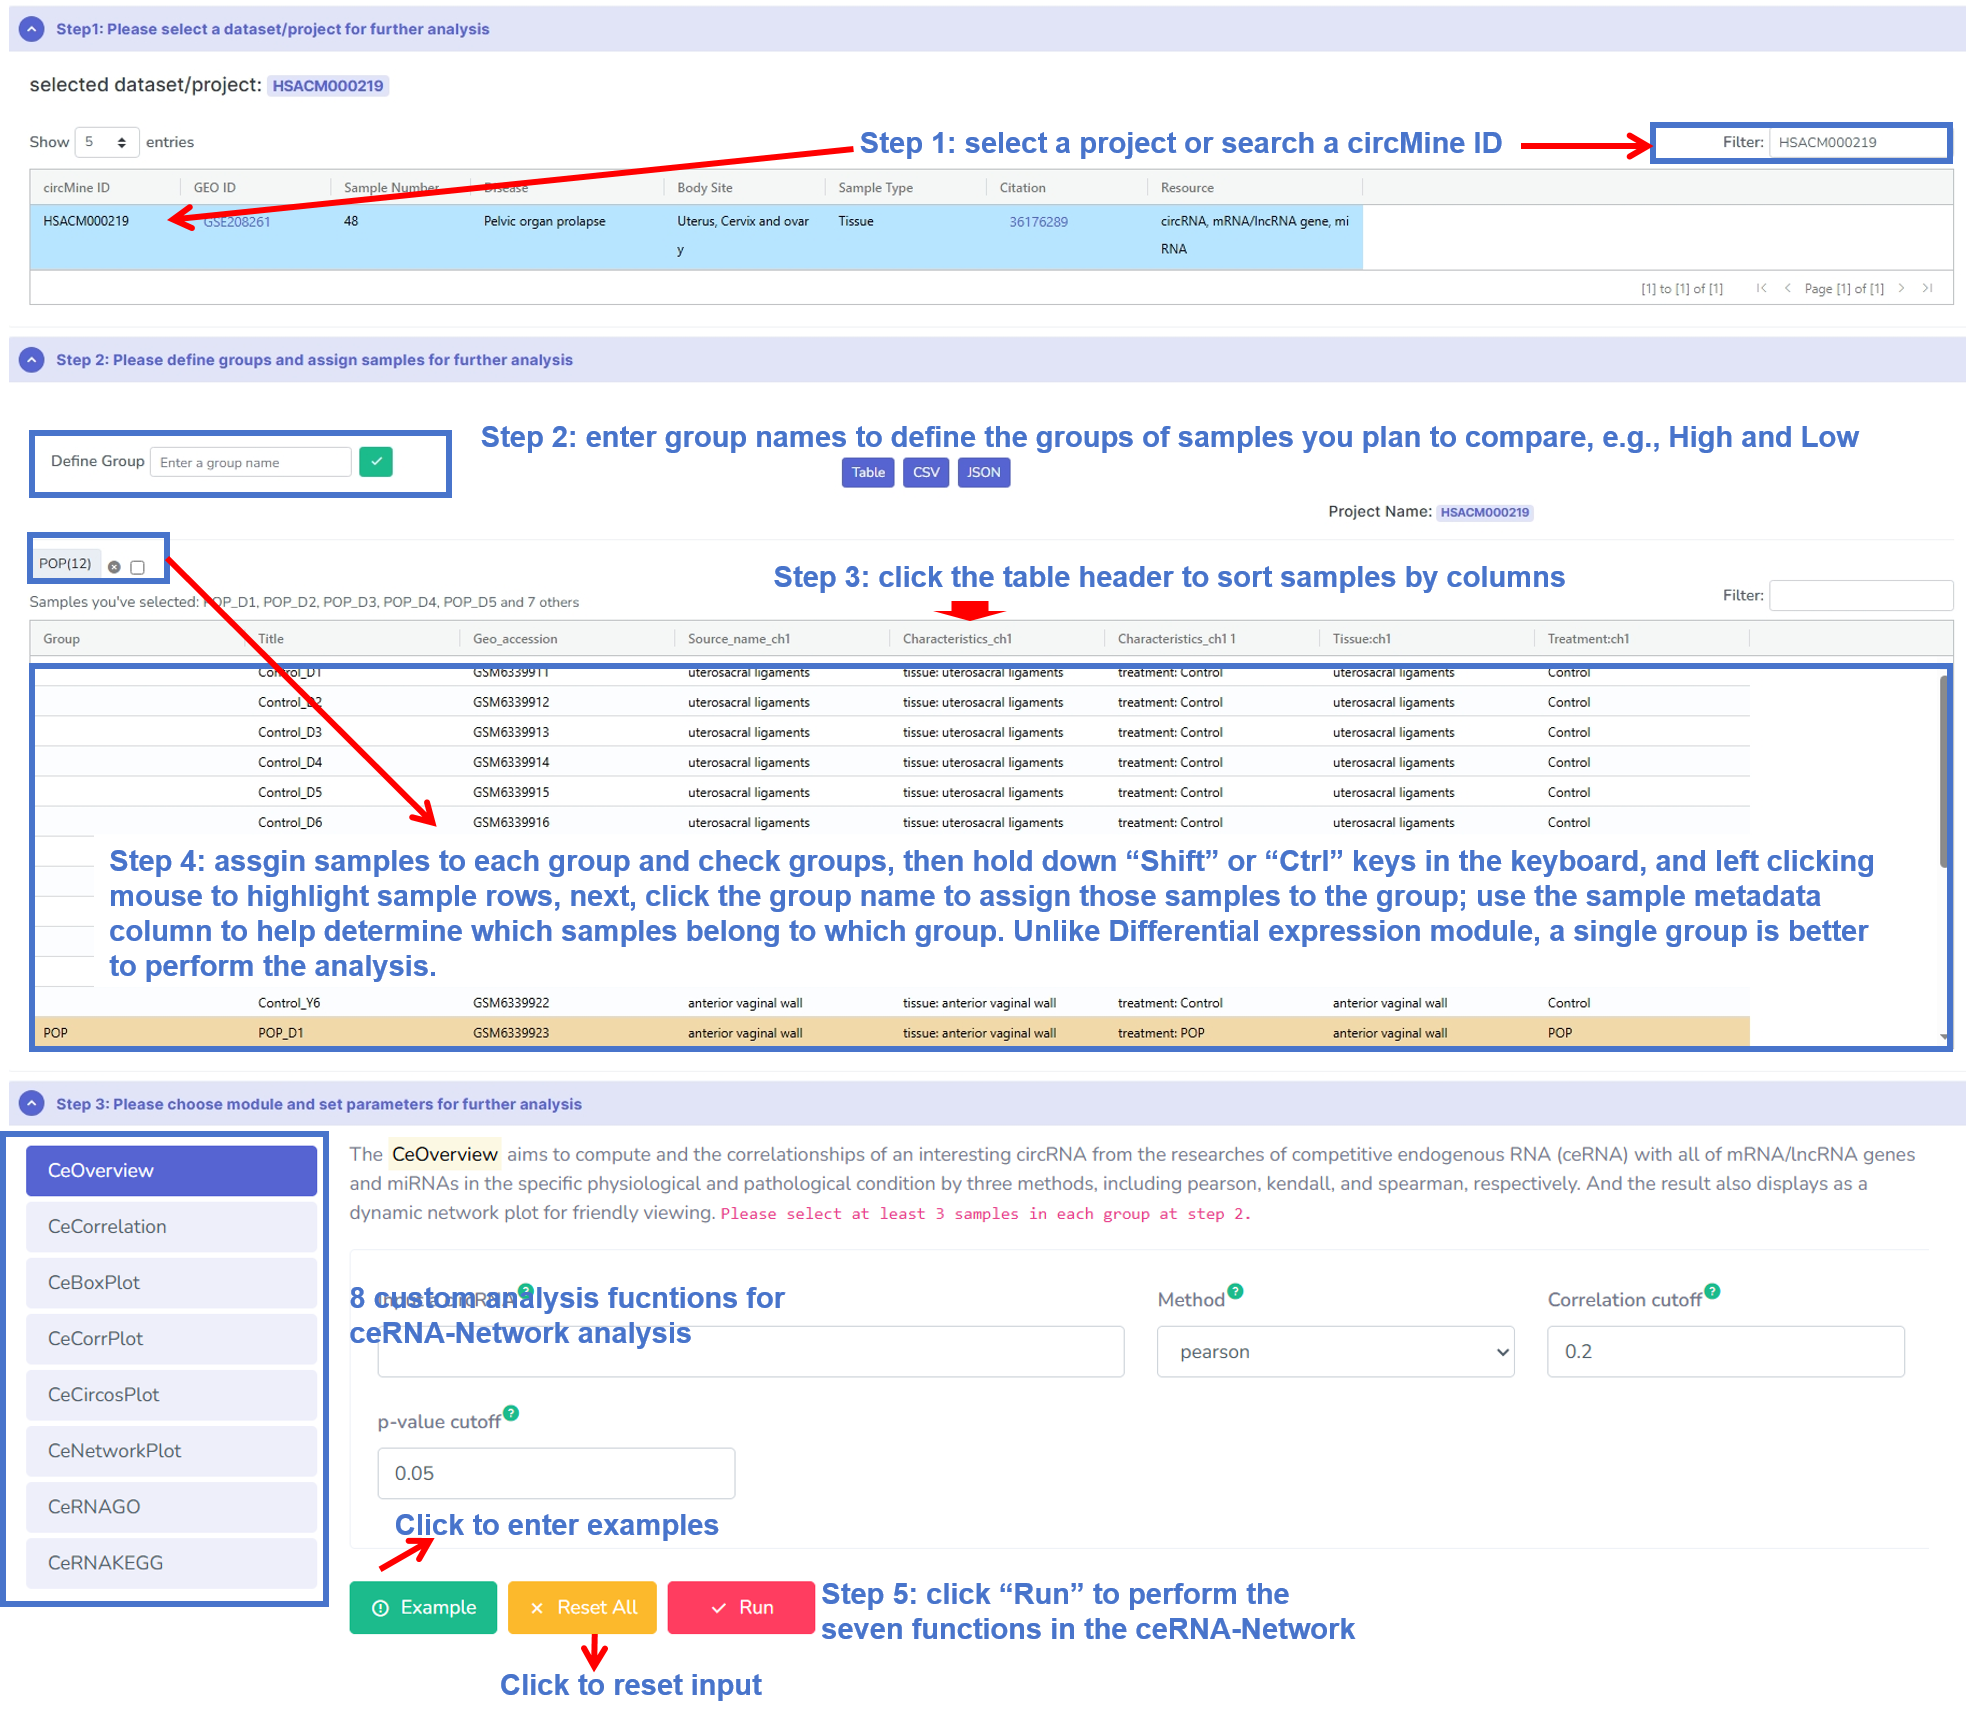
Figure 38.The web interface of the circRNA-centered network.
Description: The Overview aims to compute and the correlationships
of an interesting circRNA with mRNAs, lncRNAs, miRNAs from the selected dataset in the specific physiological and
pathological condition by three methods, including pearson, kendall, and spearman,
respectively. And the result also displays as a dynamic network plot for friendly
viewing (Figure 39).
R package(s): The dplyr and jsonlite packages are used for the data
processes. The local cor.test function is used for the correlation analysis. The
dynamic network plot are built by the API.
Parameter(s):circRNA:a circBase ID;Correlation cutoff:a threshold value for the significant correlation;p-value cutoff:a threshold p-value for the significant correlation;Method:including pearson, kendall, and spearman.
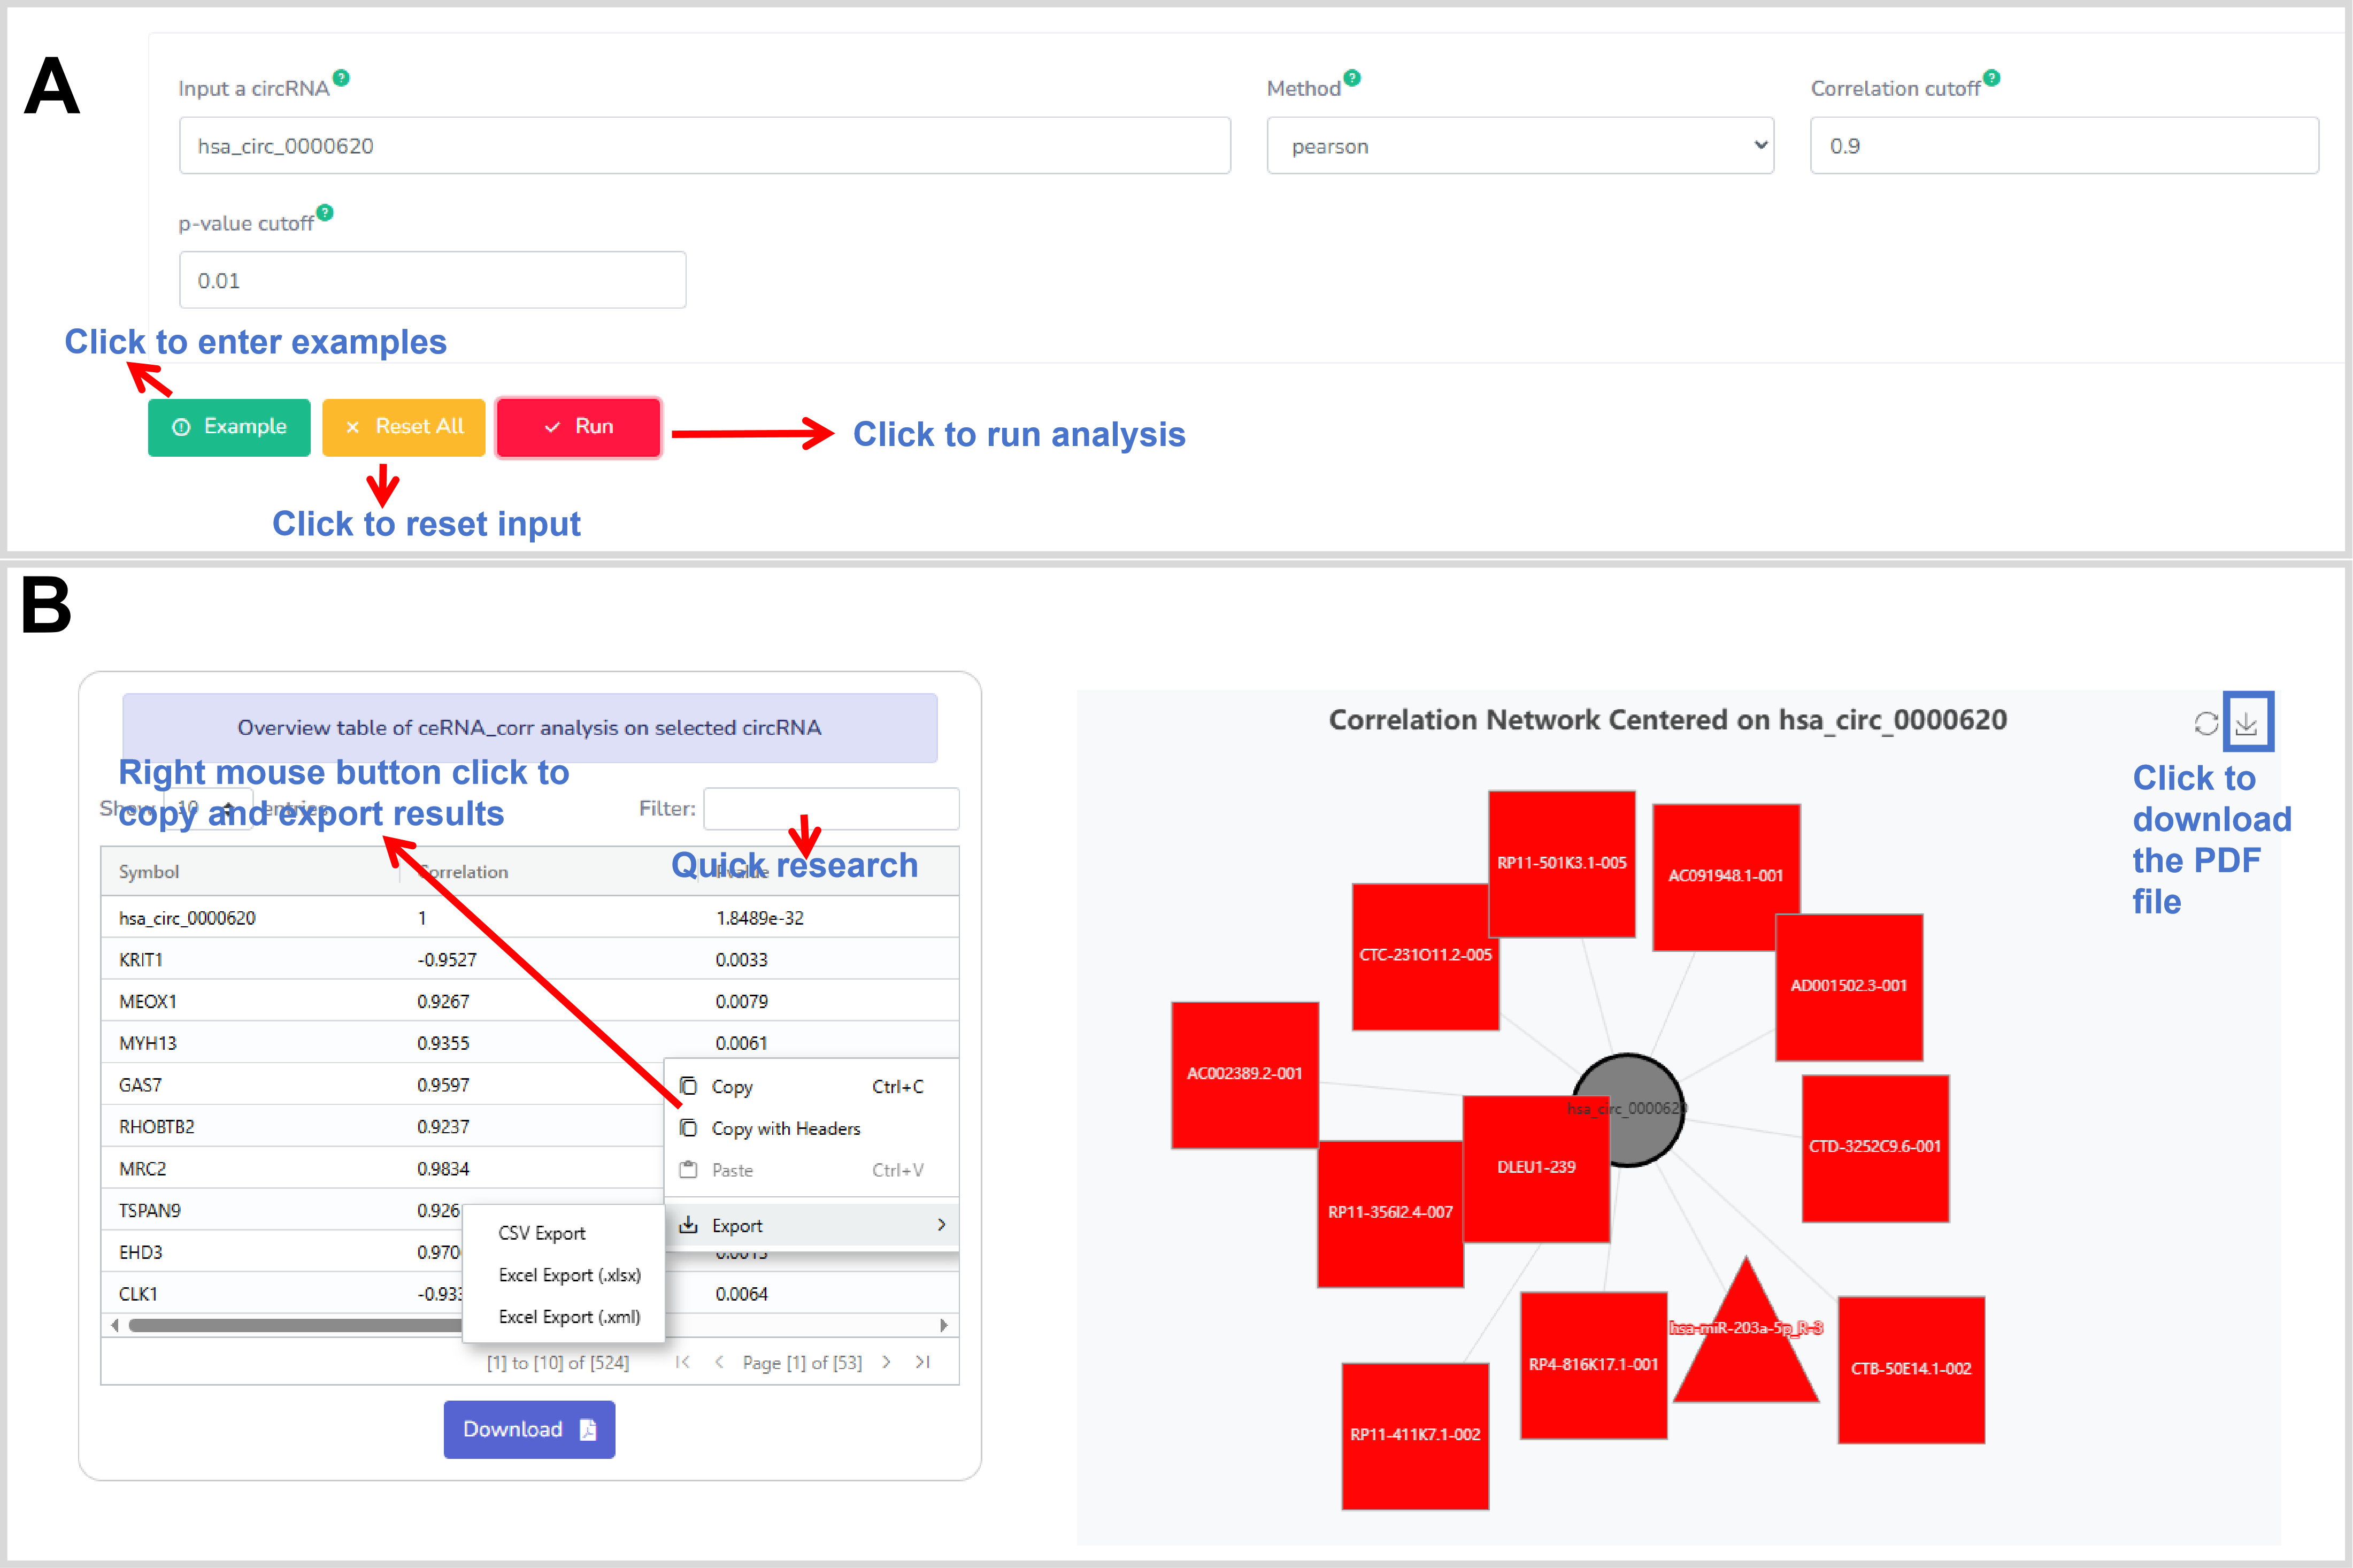
Figure 39. The web interface of the Overview in Network.
Description:
The Correlation aims to perform correlation analysis
and draw a linear graph for an interesting circRNA and an interesting mRNA/lncRNA
gene or miRNA in the specific physiological and pathological condition by three
methods, including pearson, kendall, and spearman (Figure 40).
R package(s):The dplyr package is used for the data processes. The
ggscatter function in the ggpubr package is used for the co-expression analysis of a
circRNA and a mRNA/lncRNA gene/miRNA, and and drawing a linear graph.
Parameter(s):Input 1:a circBase ID;Input 2 type:mRNA/lncRNA gene or miRNA (if data sets contain miRNA transcriptomic data) ;Input 2:a symbol of mRNA/lncRNA gene or miRNA;Method:including pearson, kendall, and spearman.
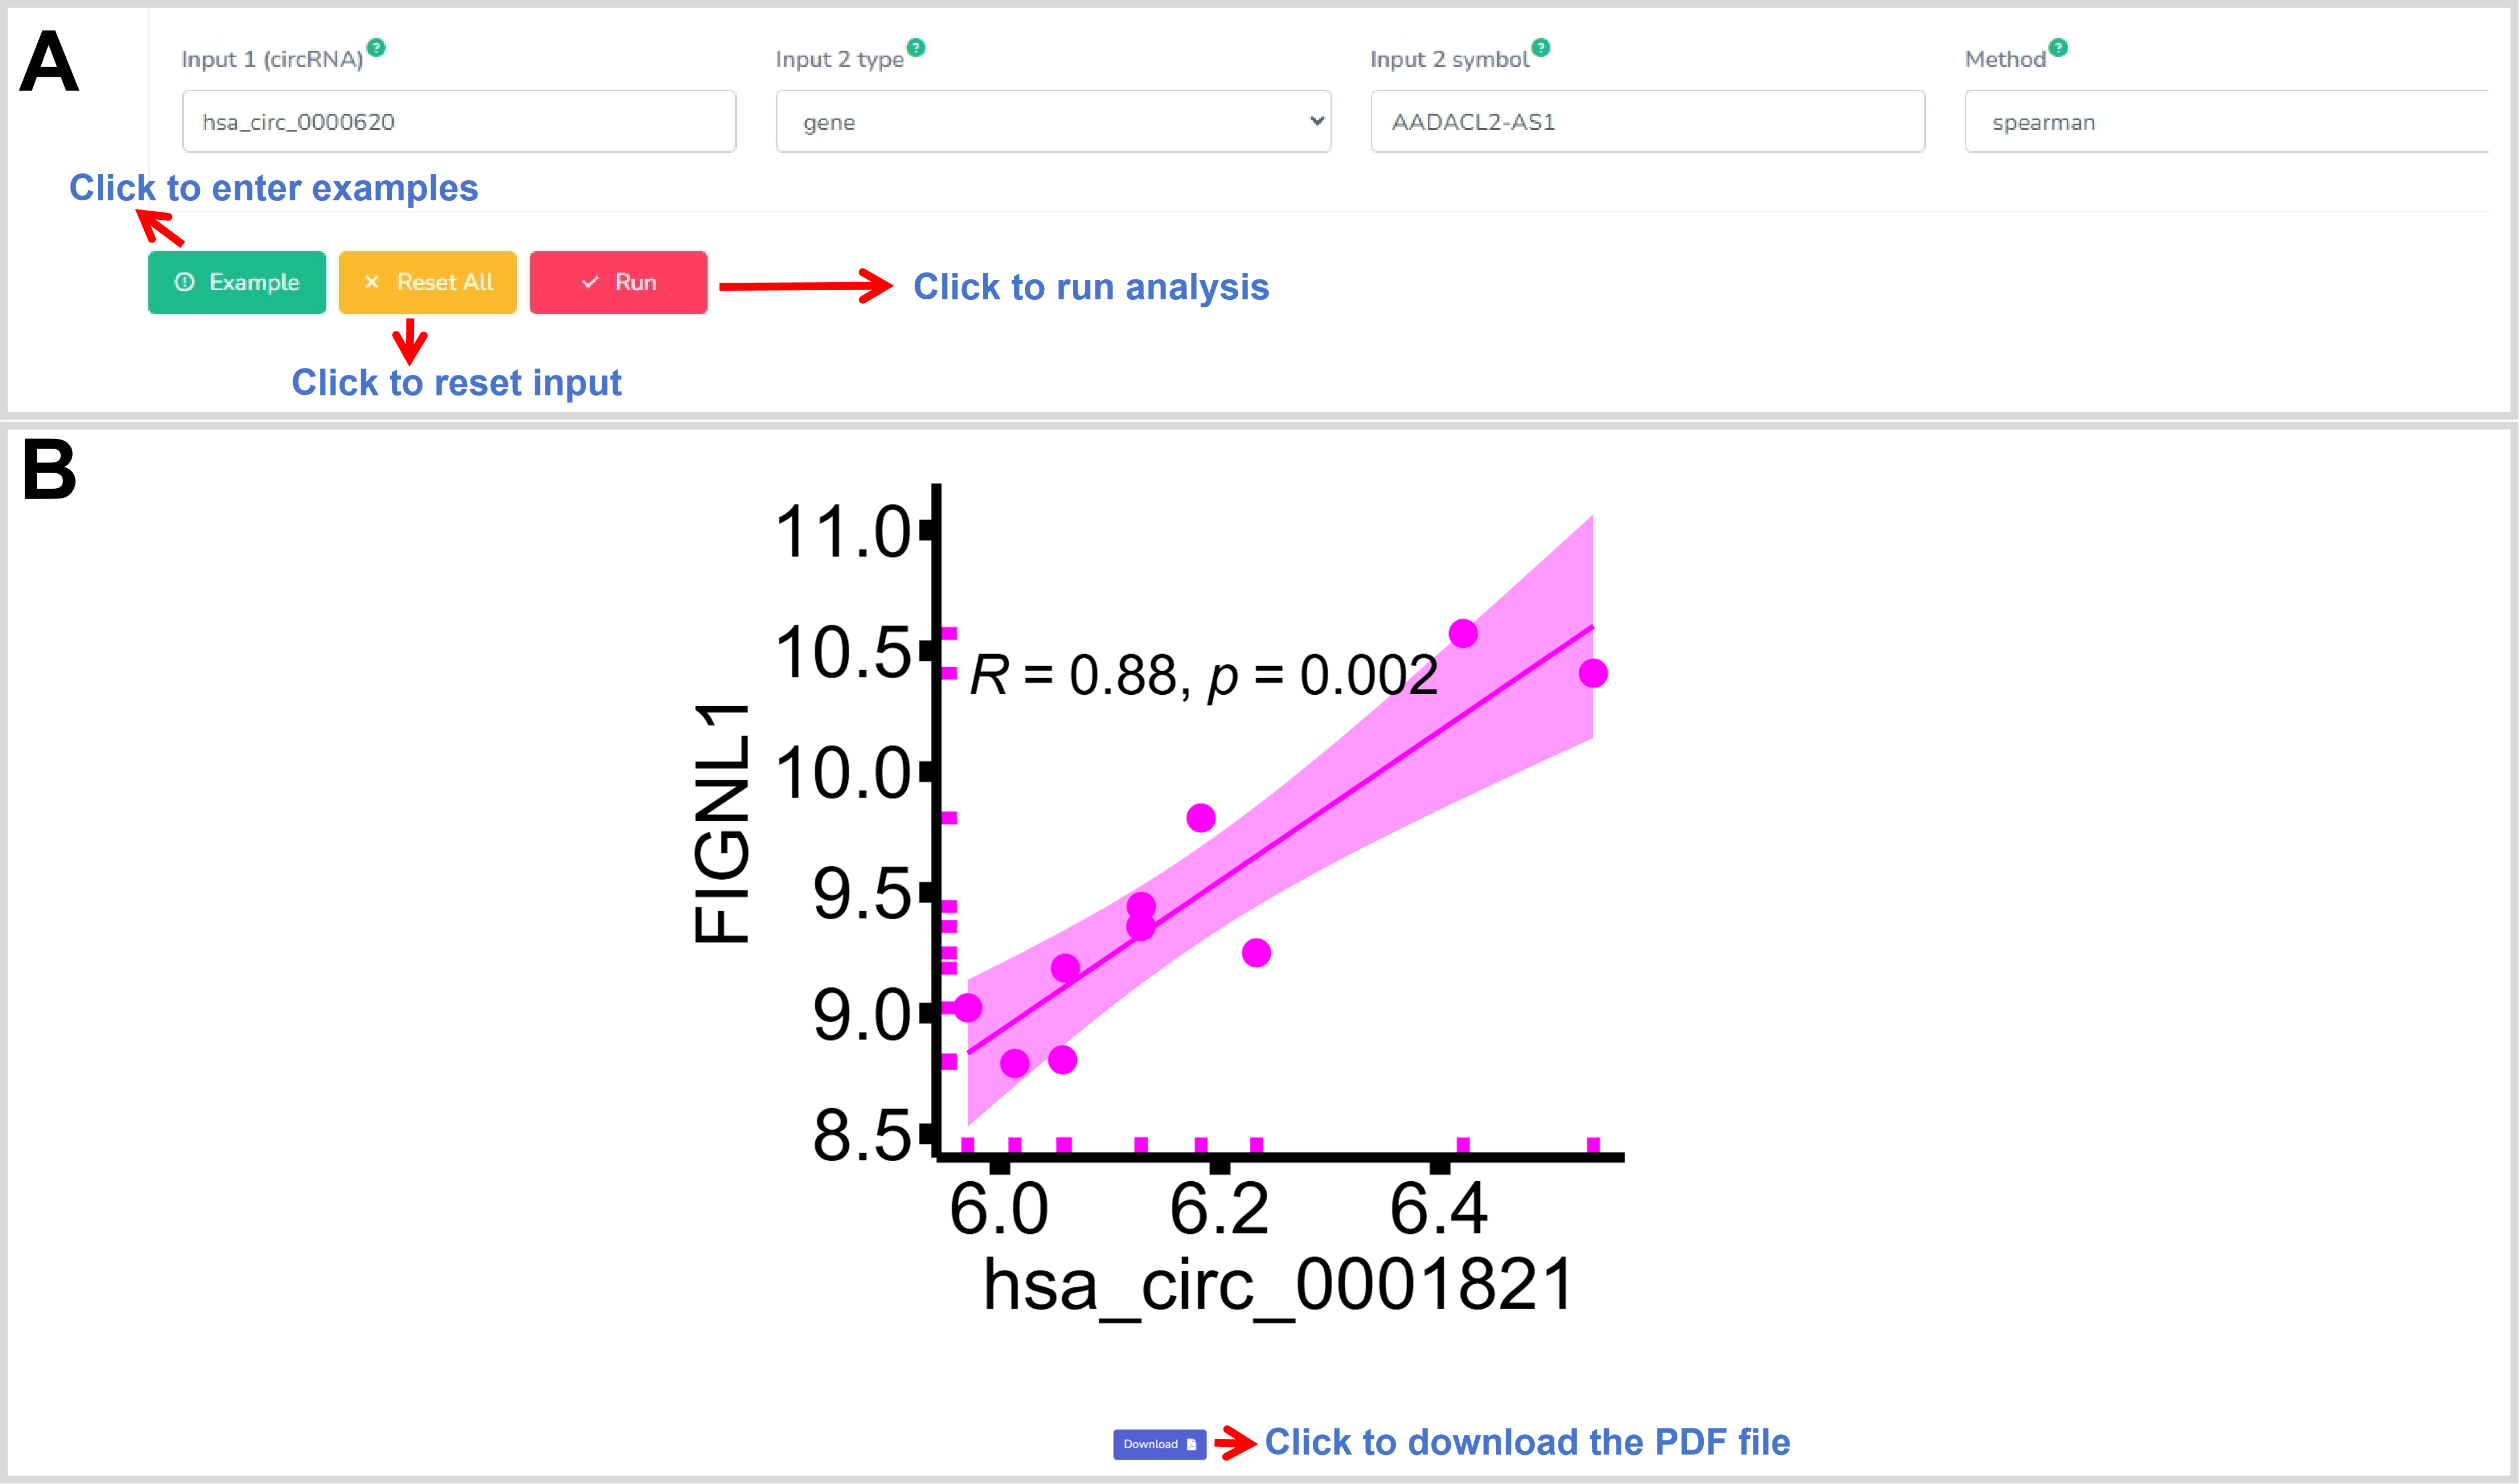
Figure 40. The web interface of the Correlation.
Description:
The BoxPlot aims to perform correlation analysis and draw a linear graph for an
interesting circRNA and an interesting mRNA/lncRNA gene or miRNA in the specific
physiological and pathological condition by three methods, including pearson,
kendall, and spearman (Figure 41).
R packages:The dplyr package is used for the data processes. The
ggscatter function in the ggpubr package is used for the co-expression analysis of
two circRNAs and drawing a box plot.
Parameter(s):Input 1:a circBase ID;Input 2 type:mRNA/lncRNA gene or miRNA (if data sets contain miRNA transcriptomic data) ;Input 2:a symbol of mRNA/lncRNA gene or miRNA;Method:including pearson, kendall, and spearman.
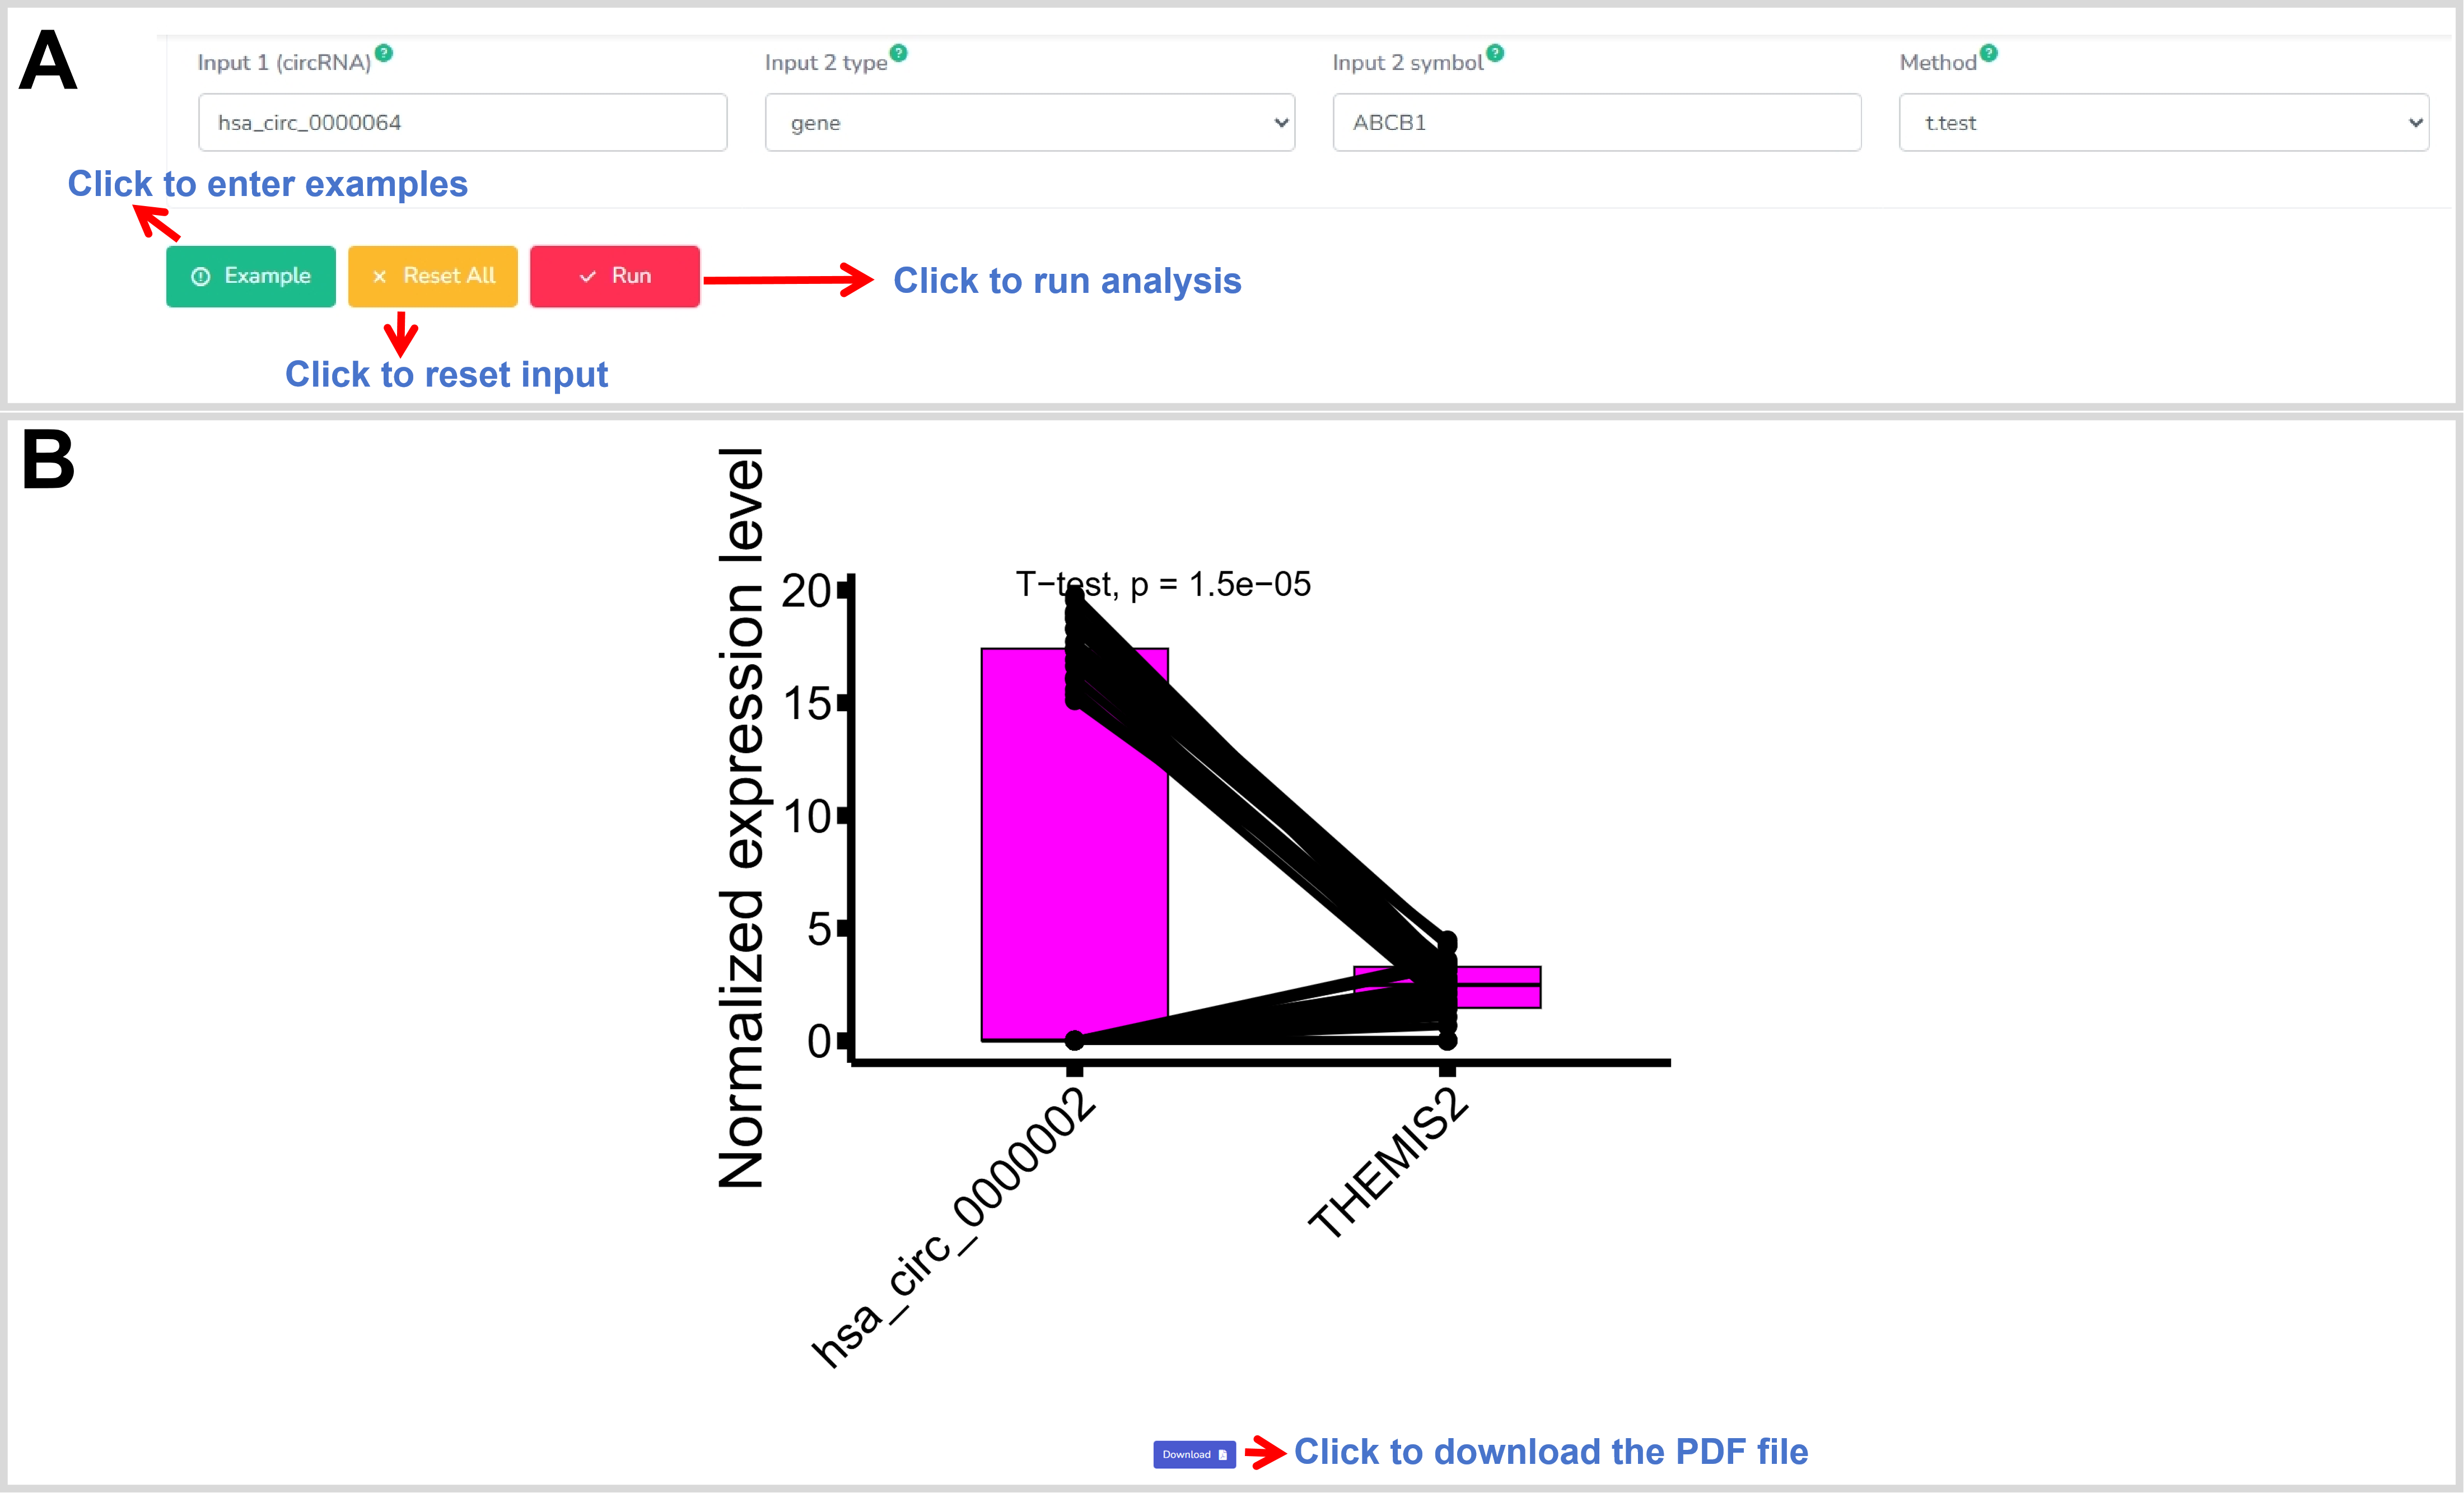
Figure 41. The web interface of the BoxPlot.
Description:
The CorrPlot in the co-expression module aims to to depict the correlationships
among several interesting circRNA(s), mRNA/lncRNA genes and miRNAs in the specific
physiological and pathological condition by two methods (including t.test and
wilcox.test), respectively. The analysis result visualizes as a boxplot (Figure 42).
R package(s): The dplyr package is used for the data processes. The
cor.test function is used for the co-expression analysis. The ggplot2 and corrplot
packages are used for the corrplot.
Parameter(s): Input circRNA(s),mRNA/lncRNA genes, or miRNAs:at least three IDs or symbols;Method:including circle, square, ellipse, number, color, pie, and shade.
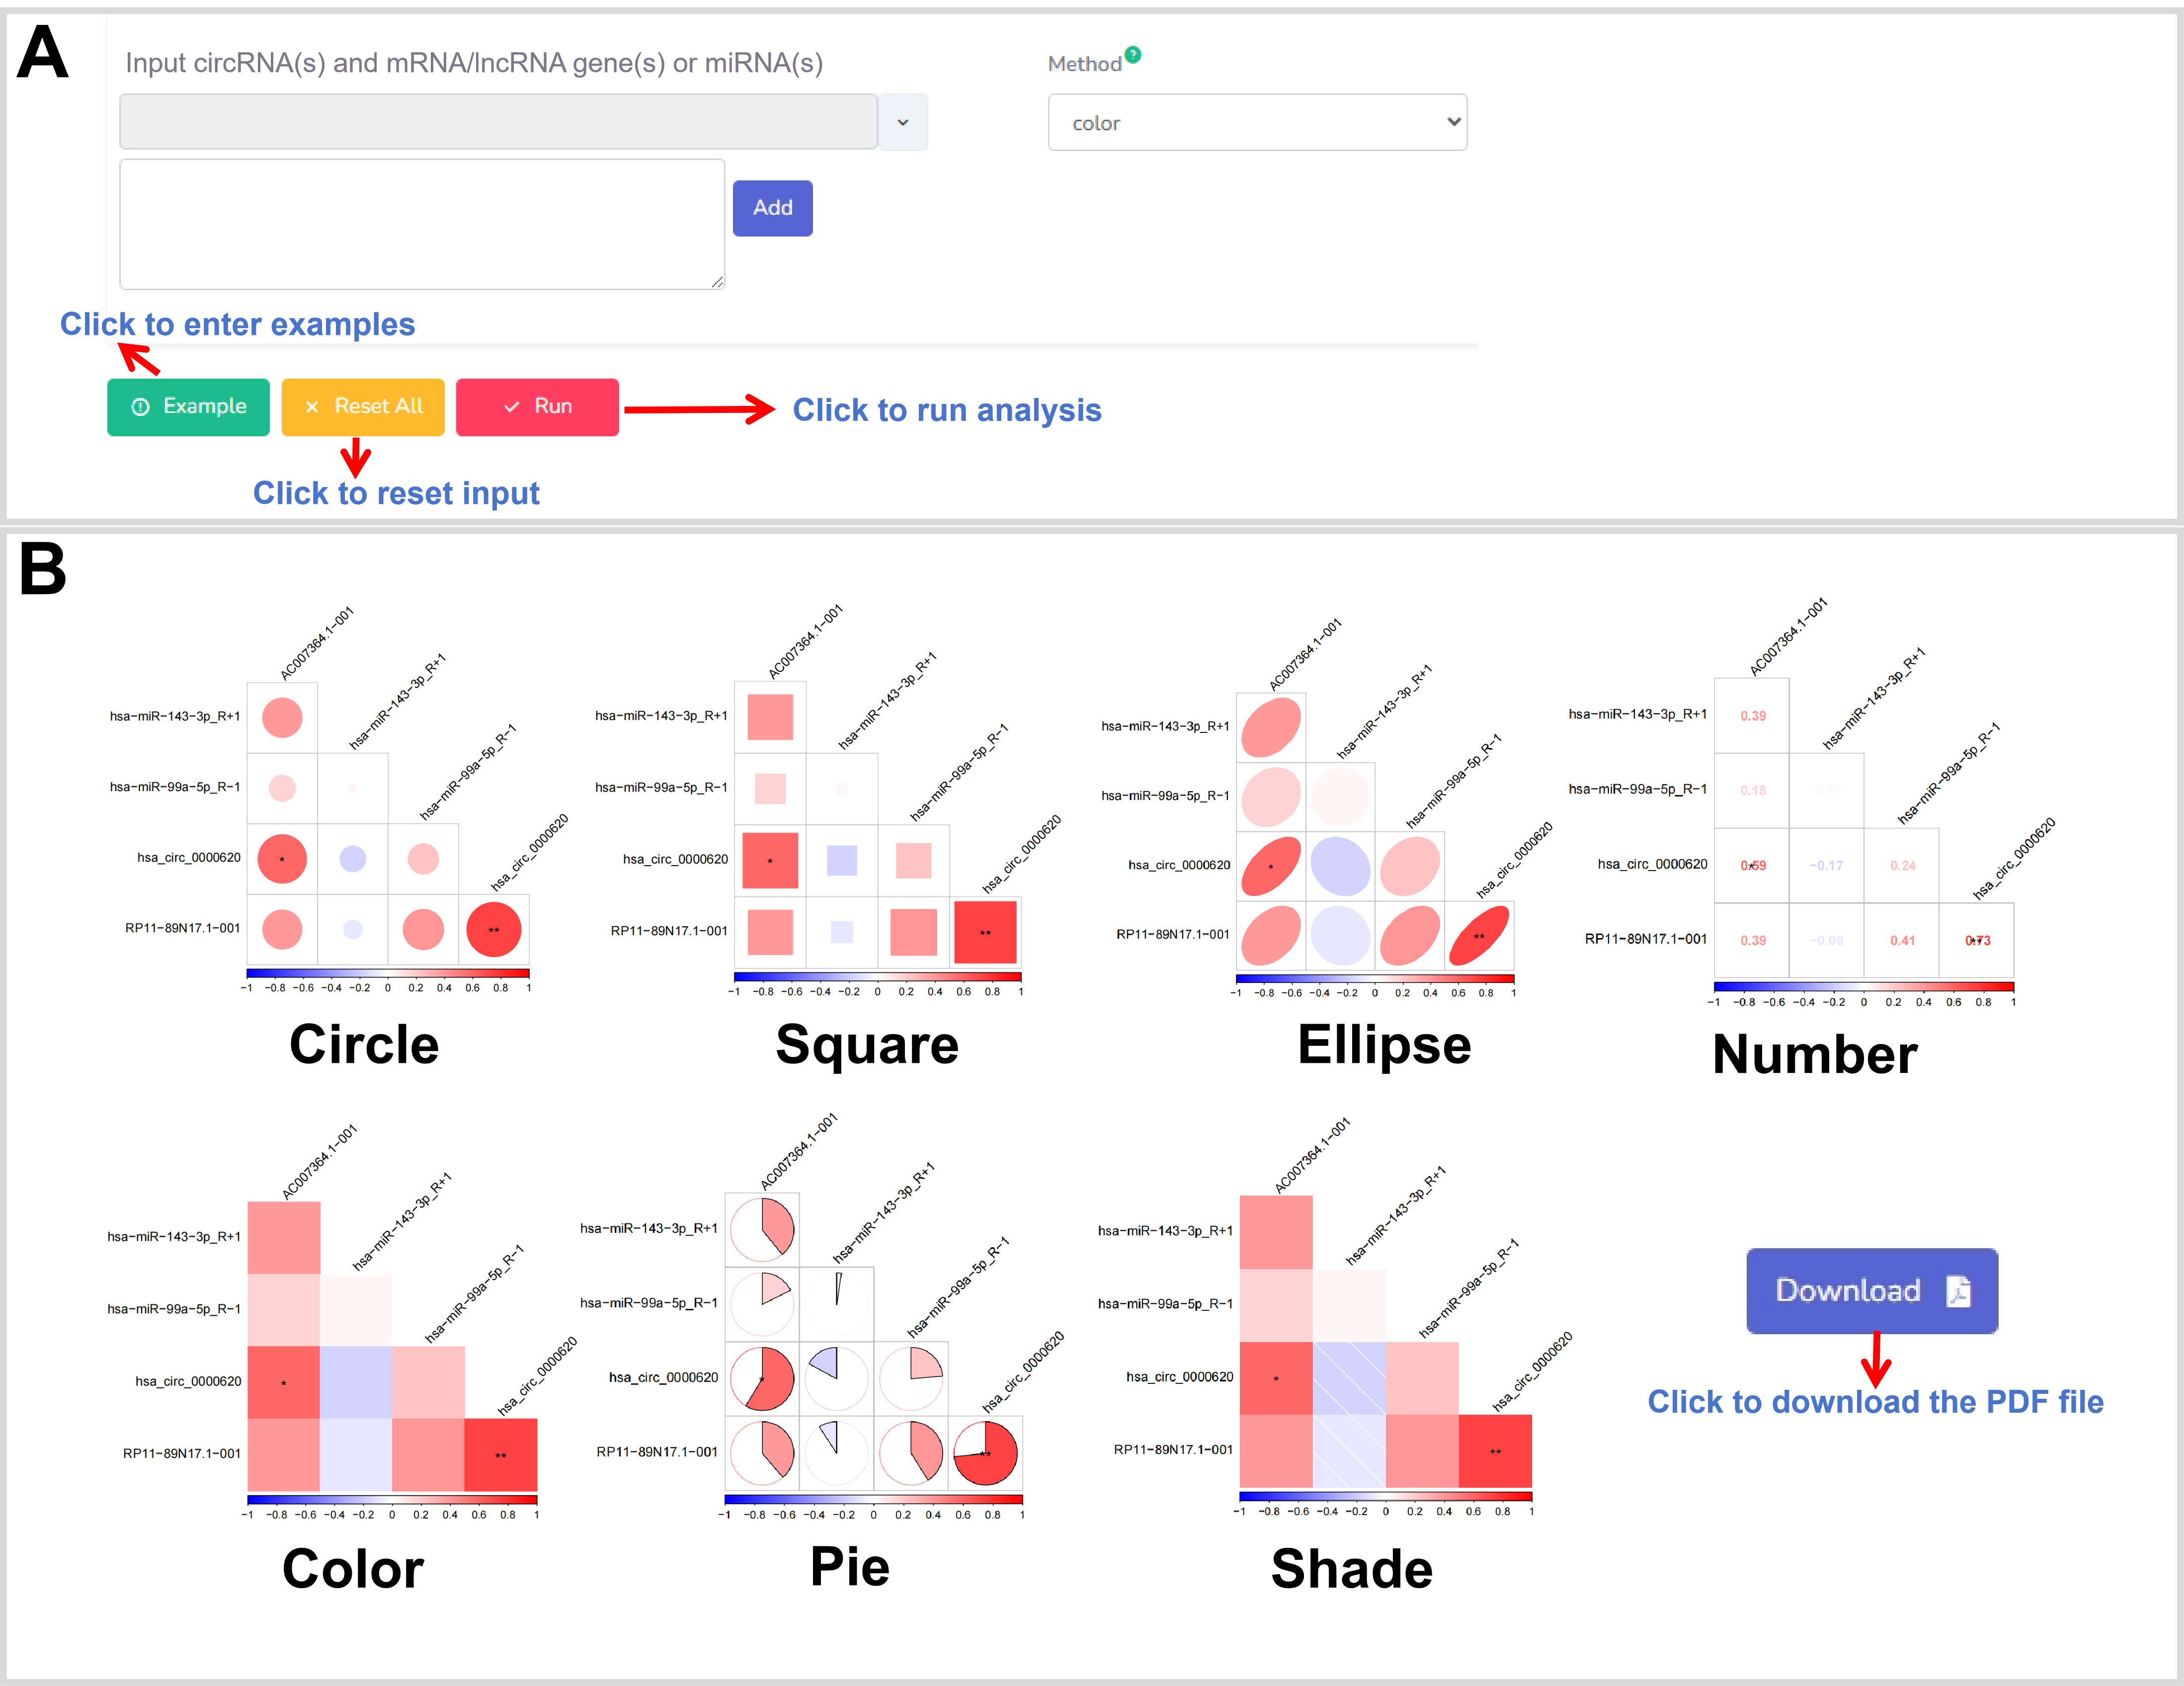
Figure 42. The web interface of the CorrPlot.
Description:
The CircosPlot analysis function aims to depict the correlationships among several
interesting circRNA(s), mRNA/lncRNA genes and miRNAs in the specific physiological
and pathological condition. The result displays as a circos plot, which can be
freely downloaded and saved as a PDF file with high resolution (Figure 43).
R package(s): The dplyr package is used for the data processes. The
cor.test function is used for the co-expression analysis. The ggplot2, corrplot and
circlize packages are used for the circos plot.
Parameter(s): Input circRNA (s), mRNA/lncRNA genes, or miRNAs:at least three IDs or symbols;Method:including pearson, kendall, and spearman.
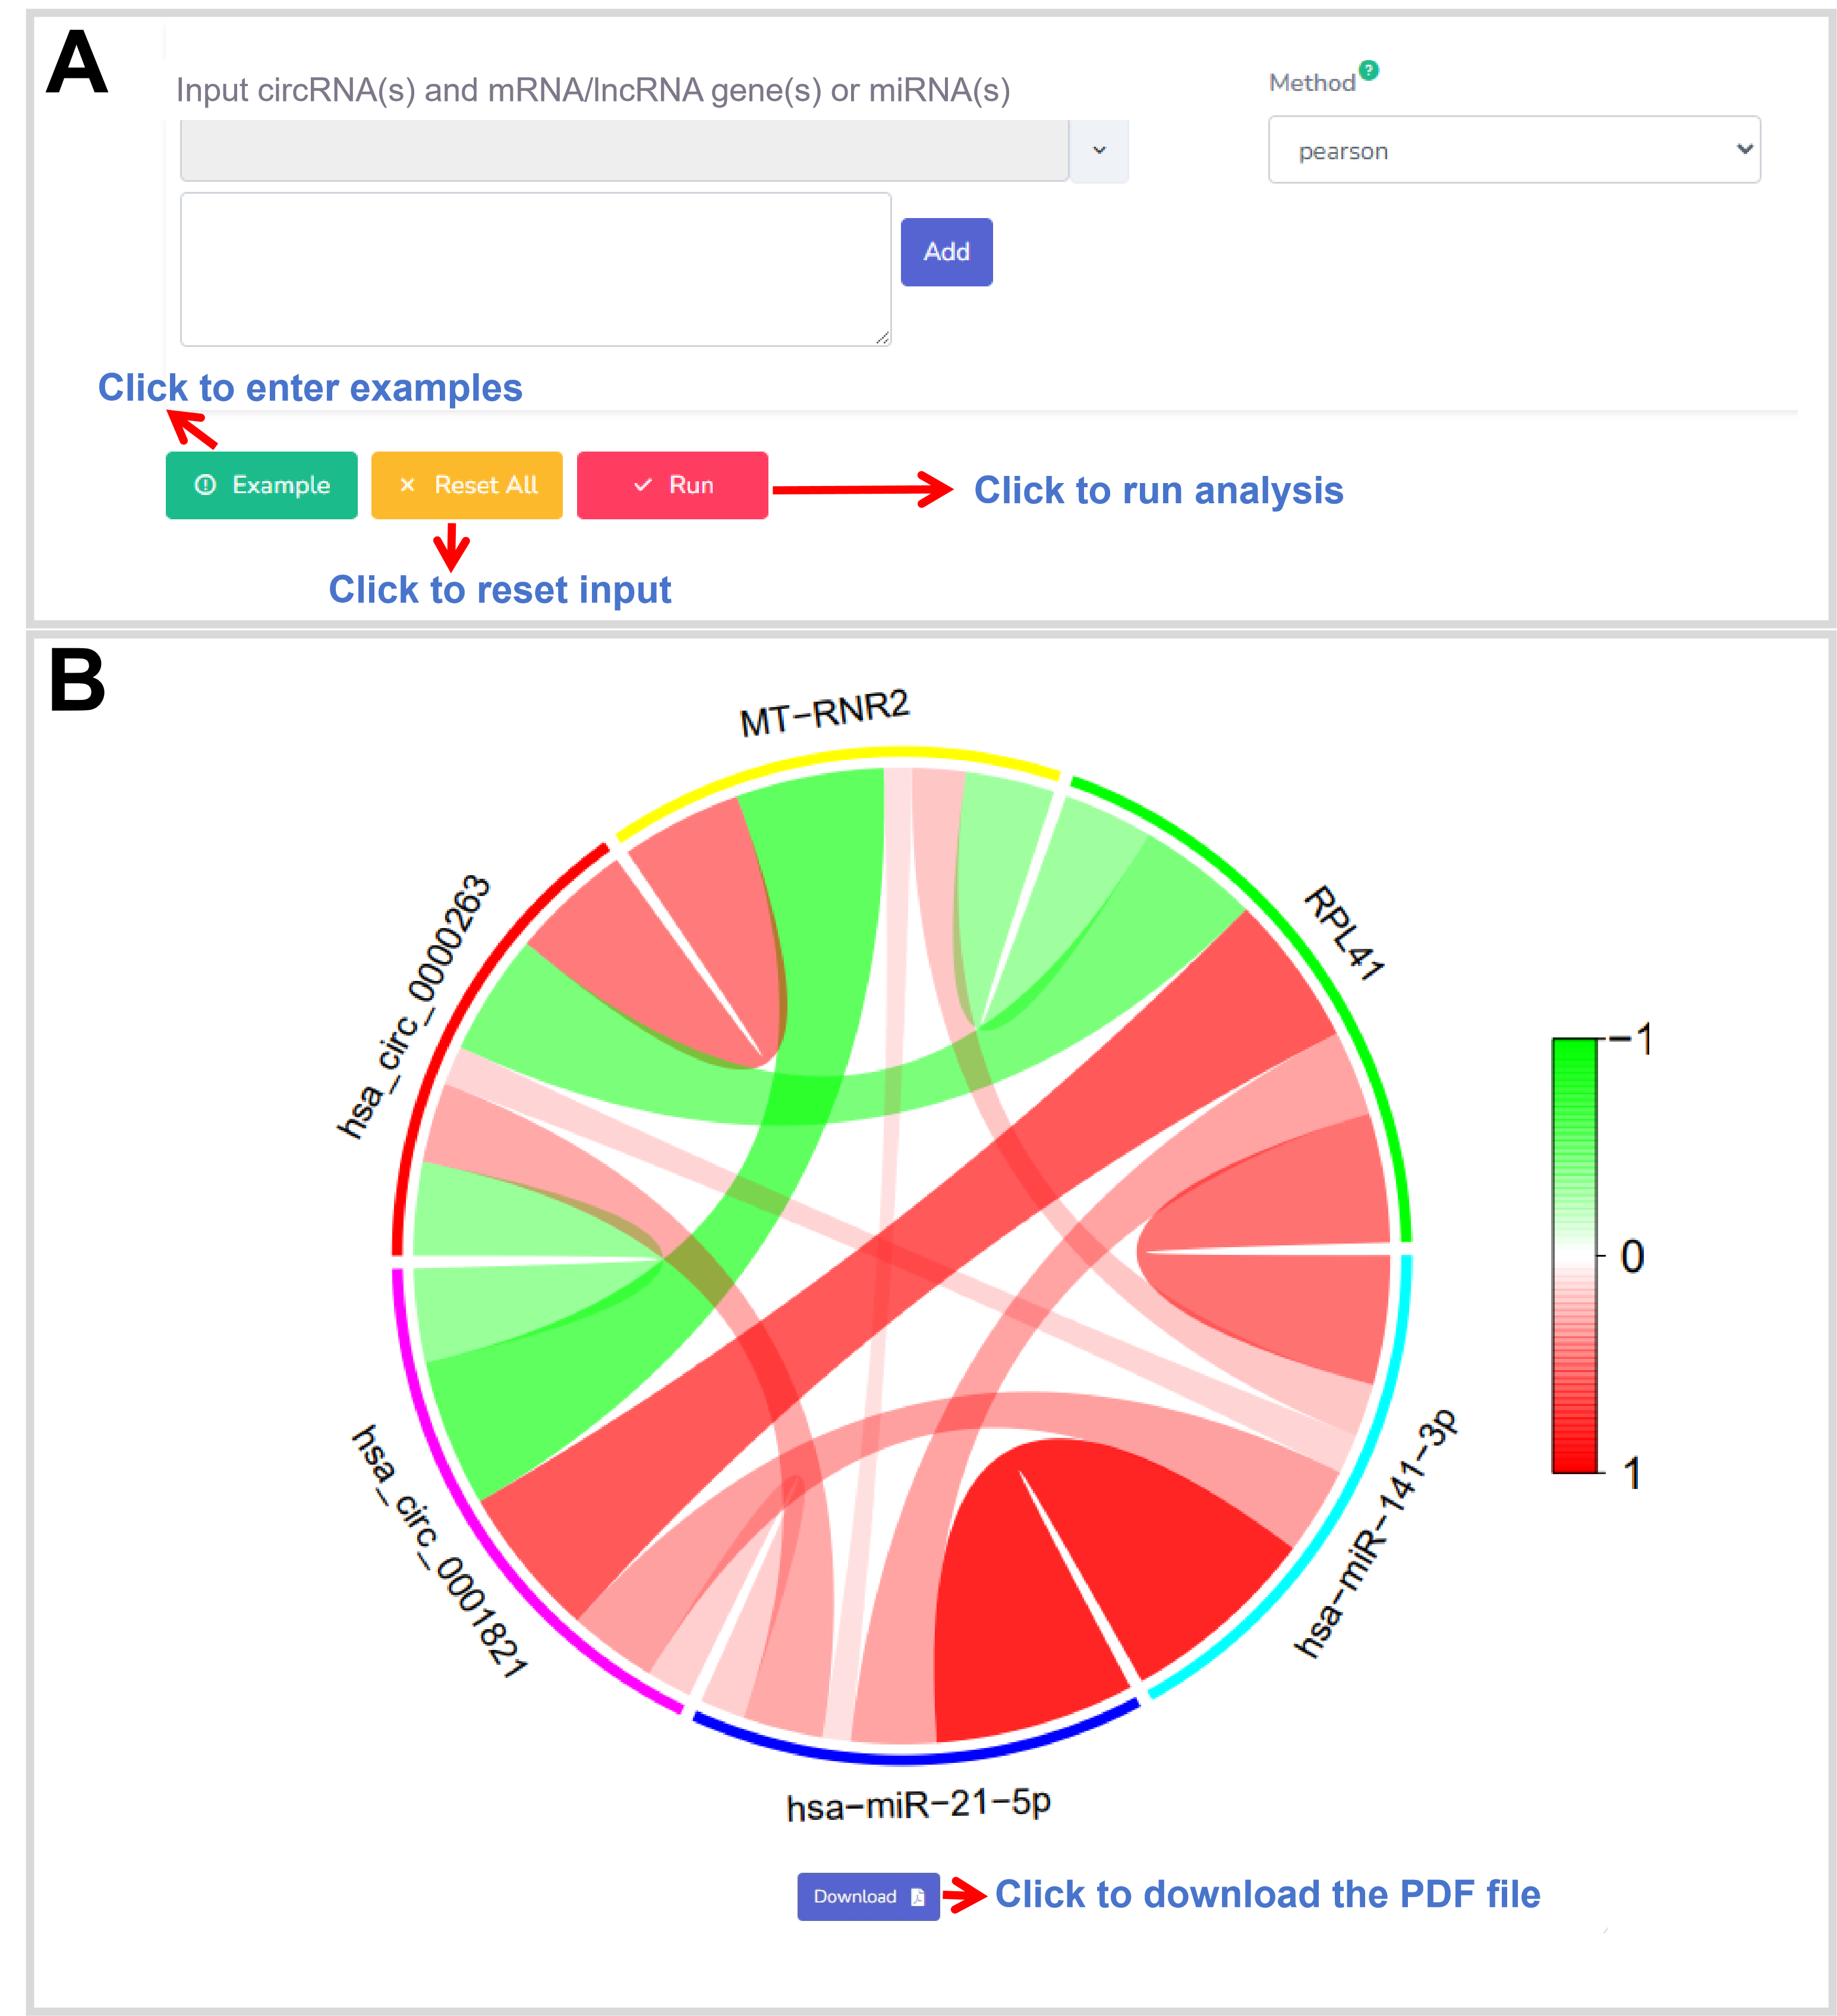
Figure 43. The web interface of the CircosPlot.
Description:
The NetworkPlot analysis function aims to analysis function aims to depict the
correlationships among several interesting circRNA(s), mRNA/lncRNA genes and miRNAs
in the specific physiological and pathological condition. The result displays as a
network plot, which can be freely downloaded and saved as a PDF file with high
resolution (Figure 44).
R package(s): The dplyr, stringr and reshape2 package is used for the
data processes. The cor.test function is used for the co-expression analysis. The
igraph packages are used for the network plots.
Parameter(s): circRNA(s):at least three circBase IDs;Correlation cutoff: :a threshold value for the significant correlation;Method:including pearson, kendall, and spearman.
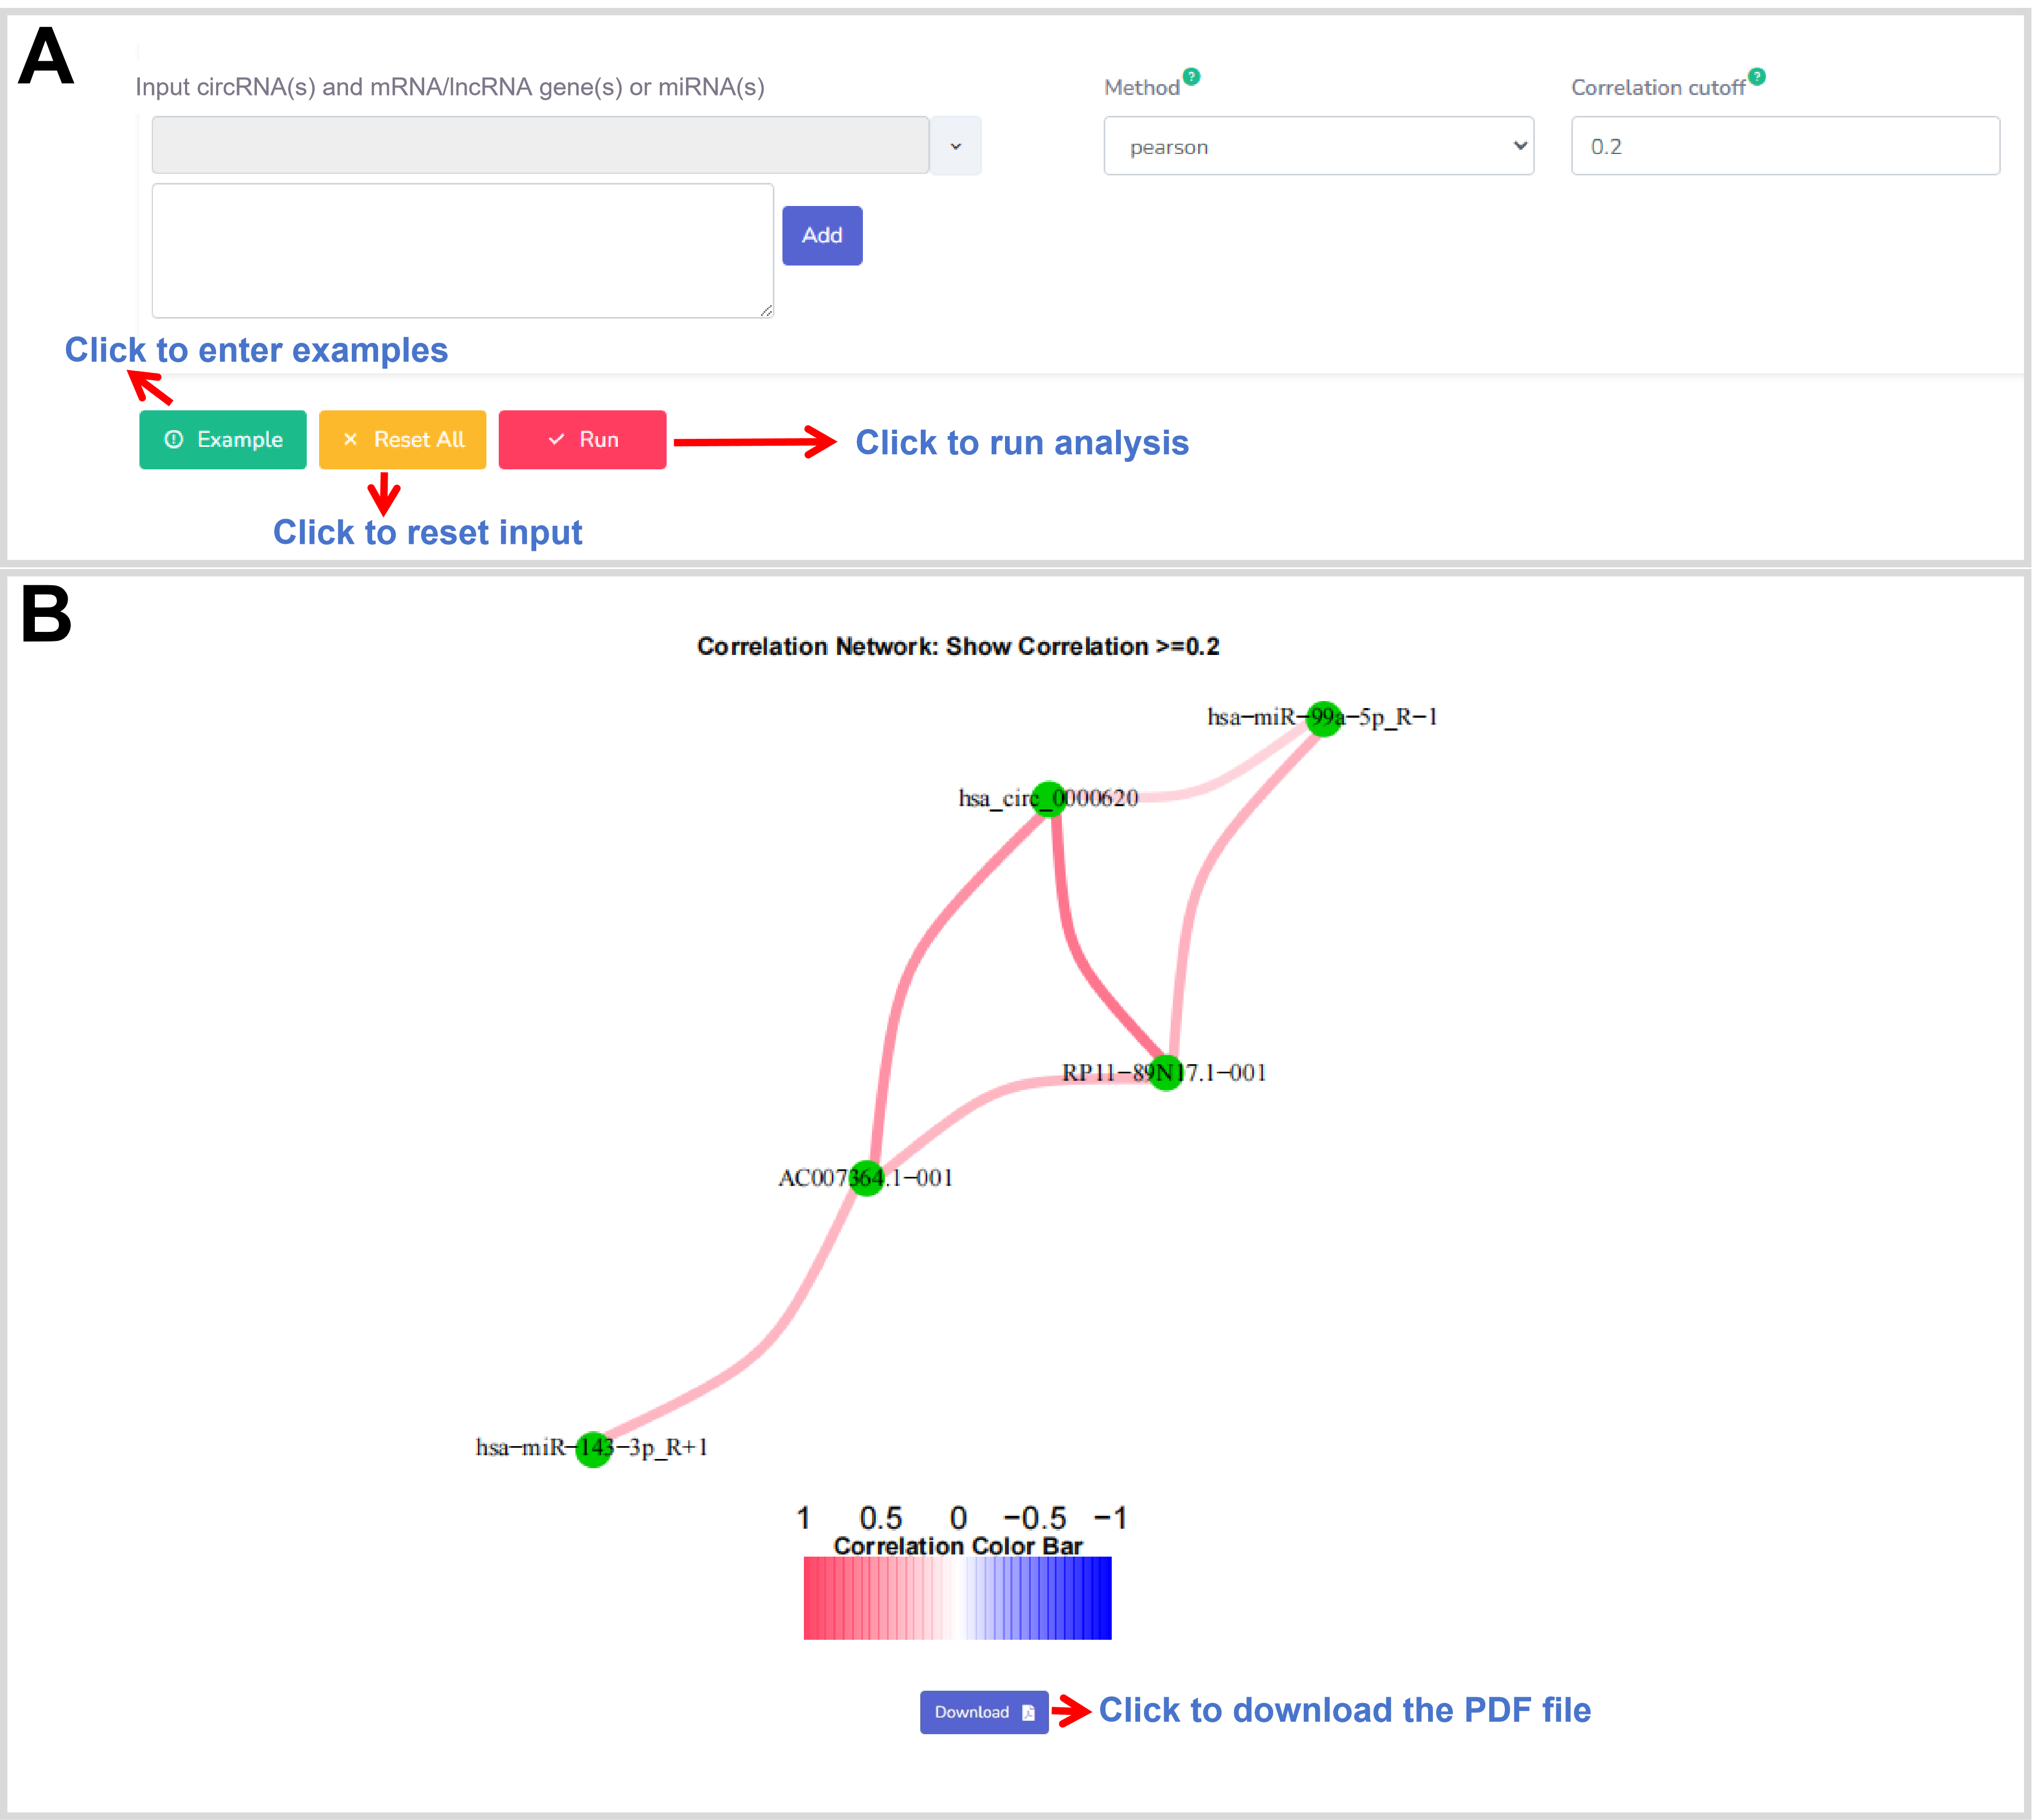
Figure 44. The web interface of the NetworkPlot.
Description:
The GO in the co-expression module is a helpful application to discover and
identify the biological functions of an interesting circRNA in the specific
physiological and pathological condition based on the annotations of its-correlated
mRNA/lncRNA genes, and miRNAs in the Gene Ontology (GO) resource. The parameters of
correlation cutoff and correlation p-value cutoff are designed to define a threshold
for the significant correlation, while the parameters of GO-p-value cutoff and
GO-q-value cutoff are aimed to define a threshold for the enriched GO term. In
addition, GO enrichment provides three methods to respectively conduct the
co-expression analyses, including pearson, kendall, and spearman. Moreover, the
GO-type parameter has designed to perform various GO enrichment analyses on all of
GO terms (All), biological process GO terms (BP), cell components GO terms (CC), or
molecular functions GO terms (MF), respectively (Figure 45).
R package(s): The cor.test function is used for the co-expression
analysis. The dplyr, jsonlite, stringr, limma, ggplot2, clusterProfiler,
org.Hs.eg.db, topGO, and Rgraphviz packages are used for the GO enrichment analysis,
involving in the data processes, dot plot, and bar plot.
Parameter(s): circRNA:a circBase ID;Correlation cutoff:a threshold value to define the significant correlation;Correlation p-value cutoff:a threshold p-value to define the significant correlation;GO-p-value:a threshold p-value for the enriched GO term;GO-q-value:a threshold q-value for the enriched GO term;GO-type:including All (all GO terms), BC (biological processes GO terms), CC (cell components GO terms), and MF (molecular functions GO terms);Method:including pearson, kendall, and spearman.
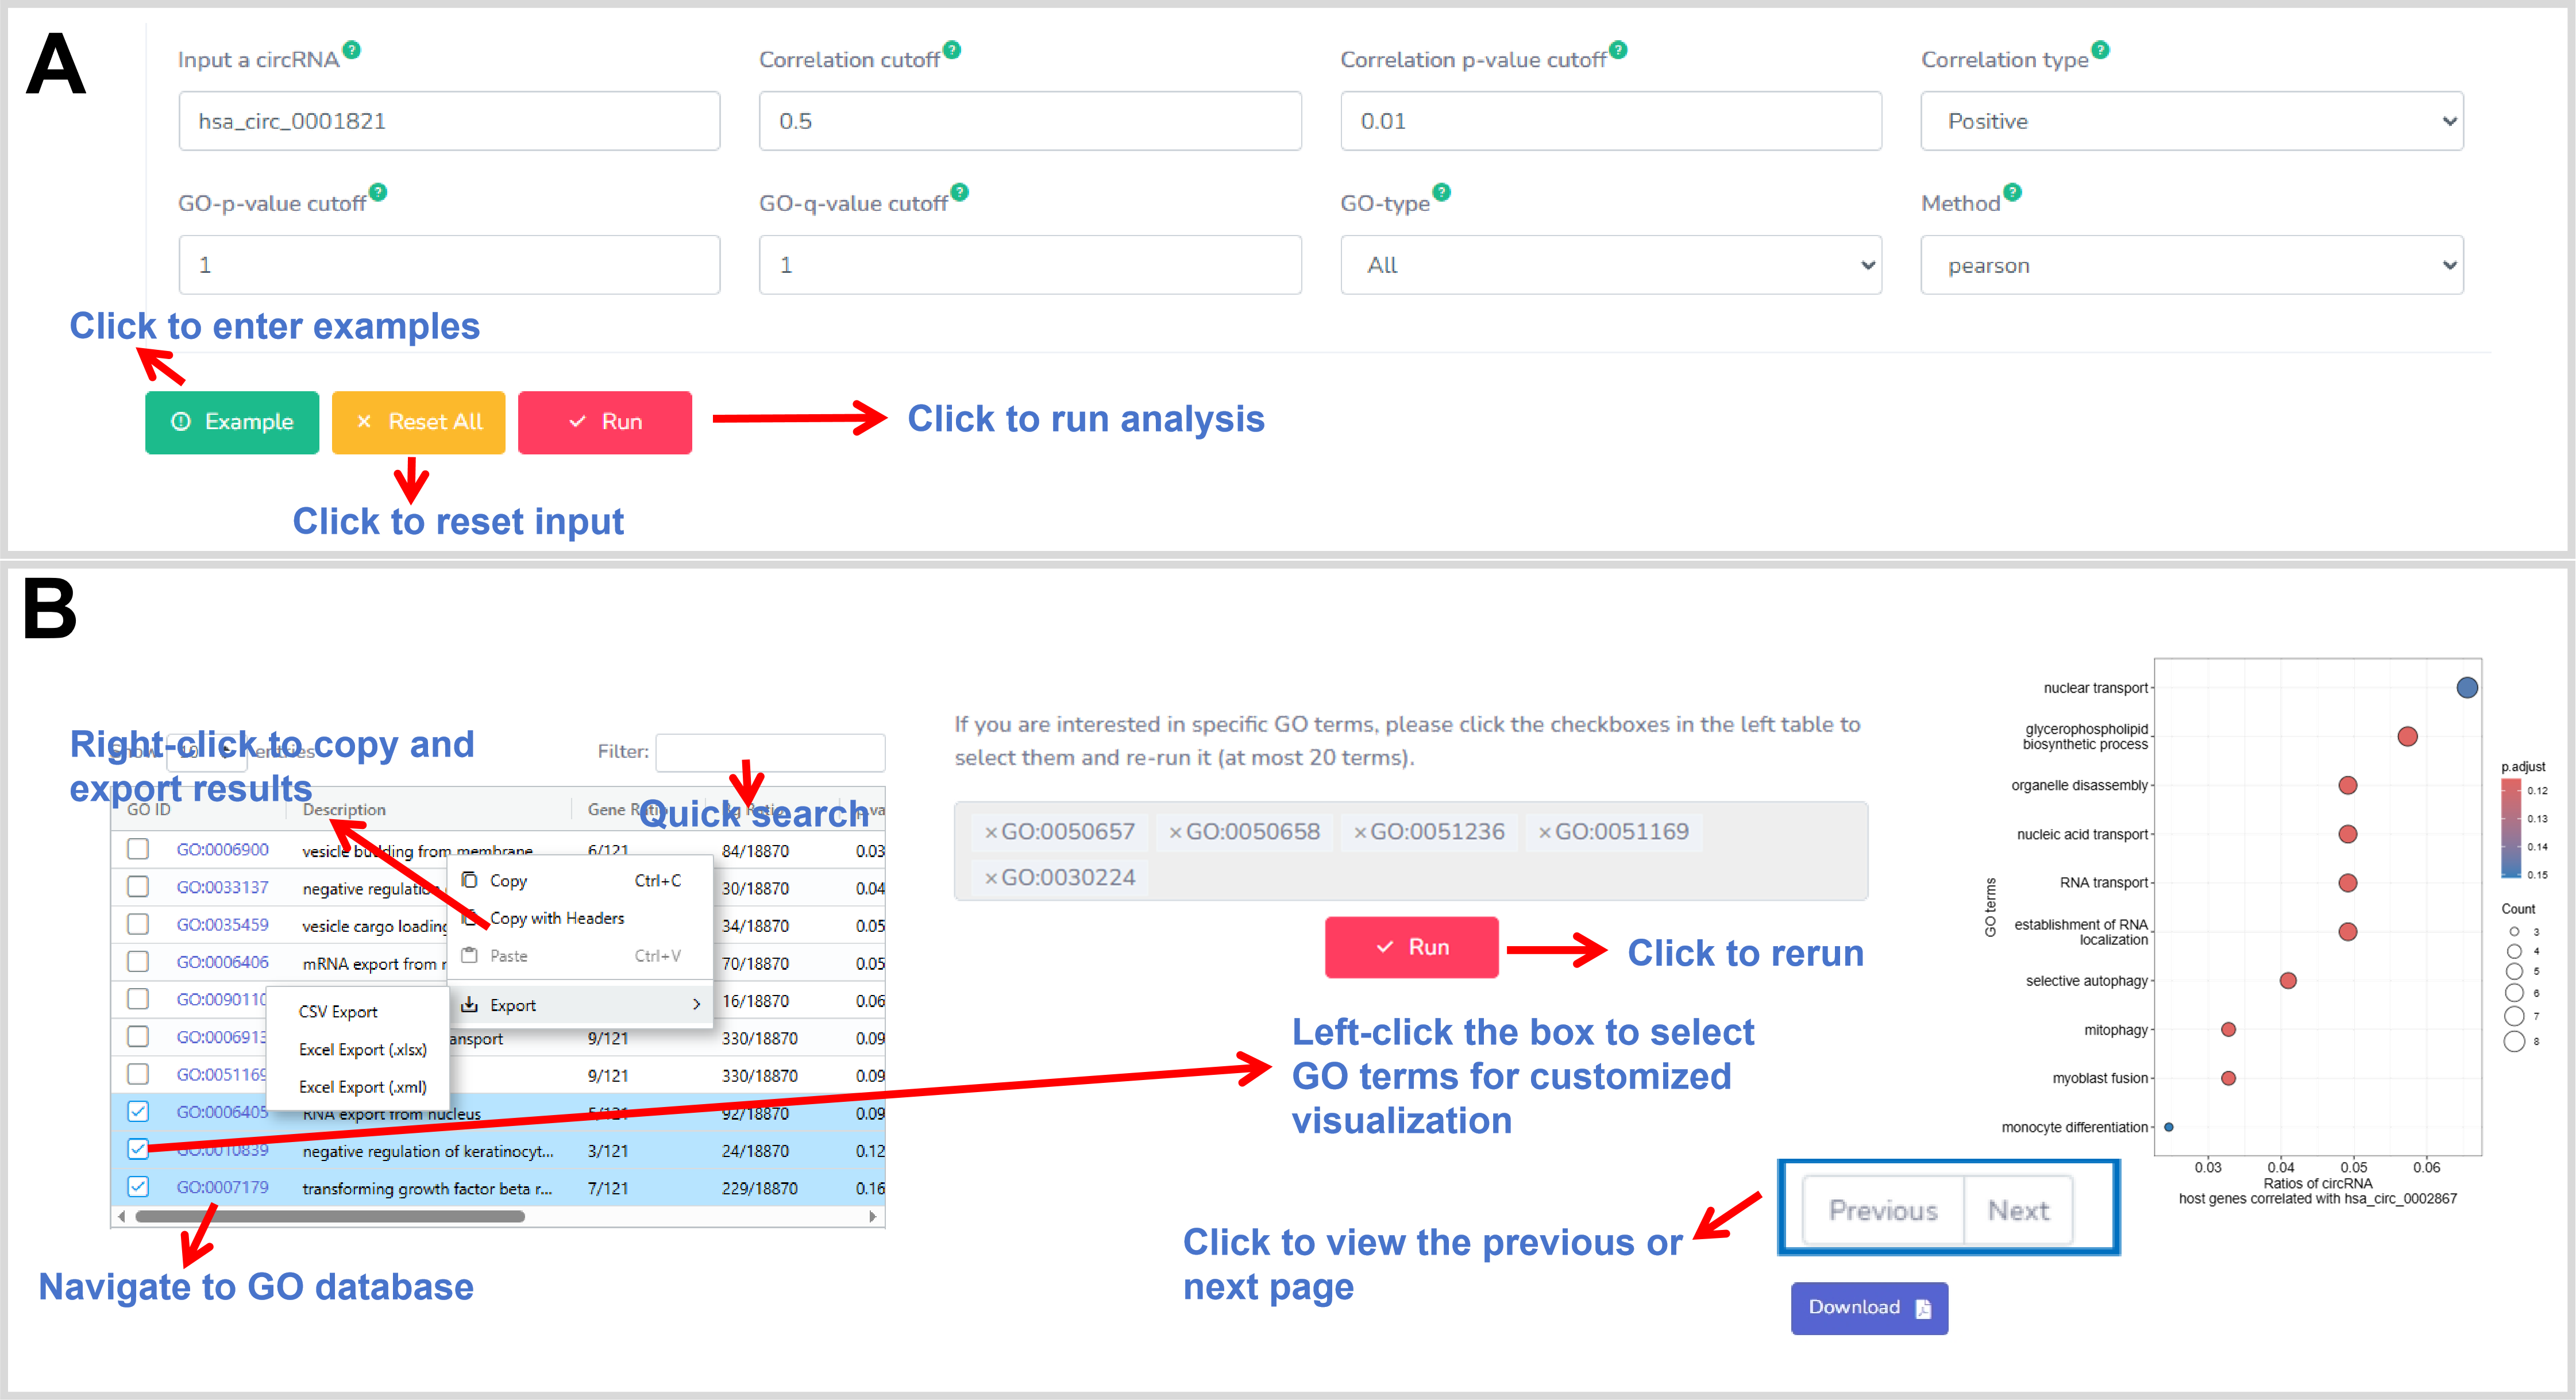
Figure 45. The web interface of the GO.
Description:
The KEGG in the co-expression module has designed to discover and identify the
biological pathways of an interesting circRNA in the specific physiological and
pathological condition based on the pathway annotations of its-correlated
mRNA/lncRNA genes, and miRNAs in the KEGG resource. The KEGG enrichment application
provides the parameters of correlation cutoff, correlation p-value cutoff,
KEGG-p-value cutoff, and KEGG-q-value cutoff to define a threshold for the
significant co-expression circRNA and the enriched KEGG term, respectively. In
addition, the KEGG enrichment application offers three methods (including pearson,
kendall, and spearman) for custom setting to perform co-expression analyses,
respectively (Figure 46).
R package(s): The cor.test function is used for the co-expression
analysis. The dplyr, jsonlite, stringr, limma, ggplot2, clusterProfiler,
org.Hs.eg.db, Rgraphviz, and pathviewpackages are used for the KEGG enrichment
analysis, including the data processes, dot plot, and bar plot.
Parameter(s): circRNA:a circBase ID;Correlation cutoff:a threshold value to define the significant correlation;Correlation p-value cutoff:a threshold p-value to define the significant correlation;KEGG-p-value:a threshold p-value for the enriched KEGG term;KEGG-q-value:a threshold q-value for the enriched KEGG term;Method:including pearson, kendall, and spearman.
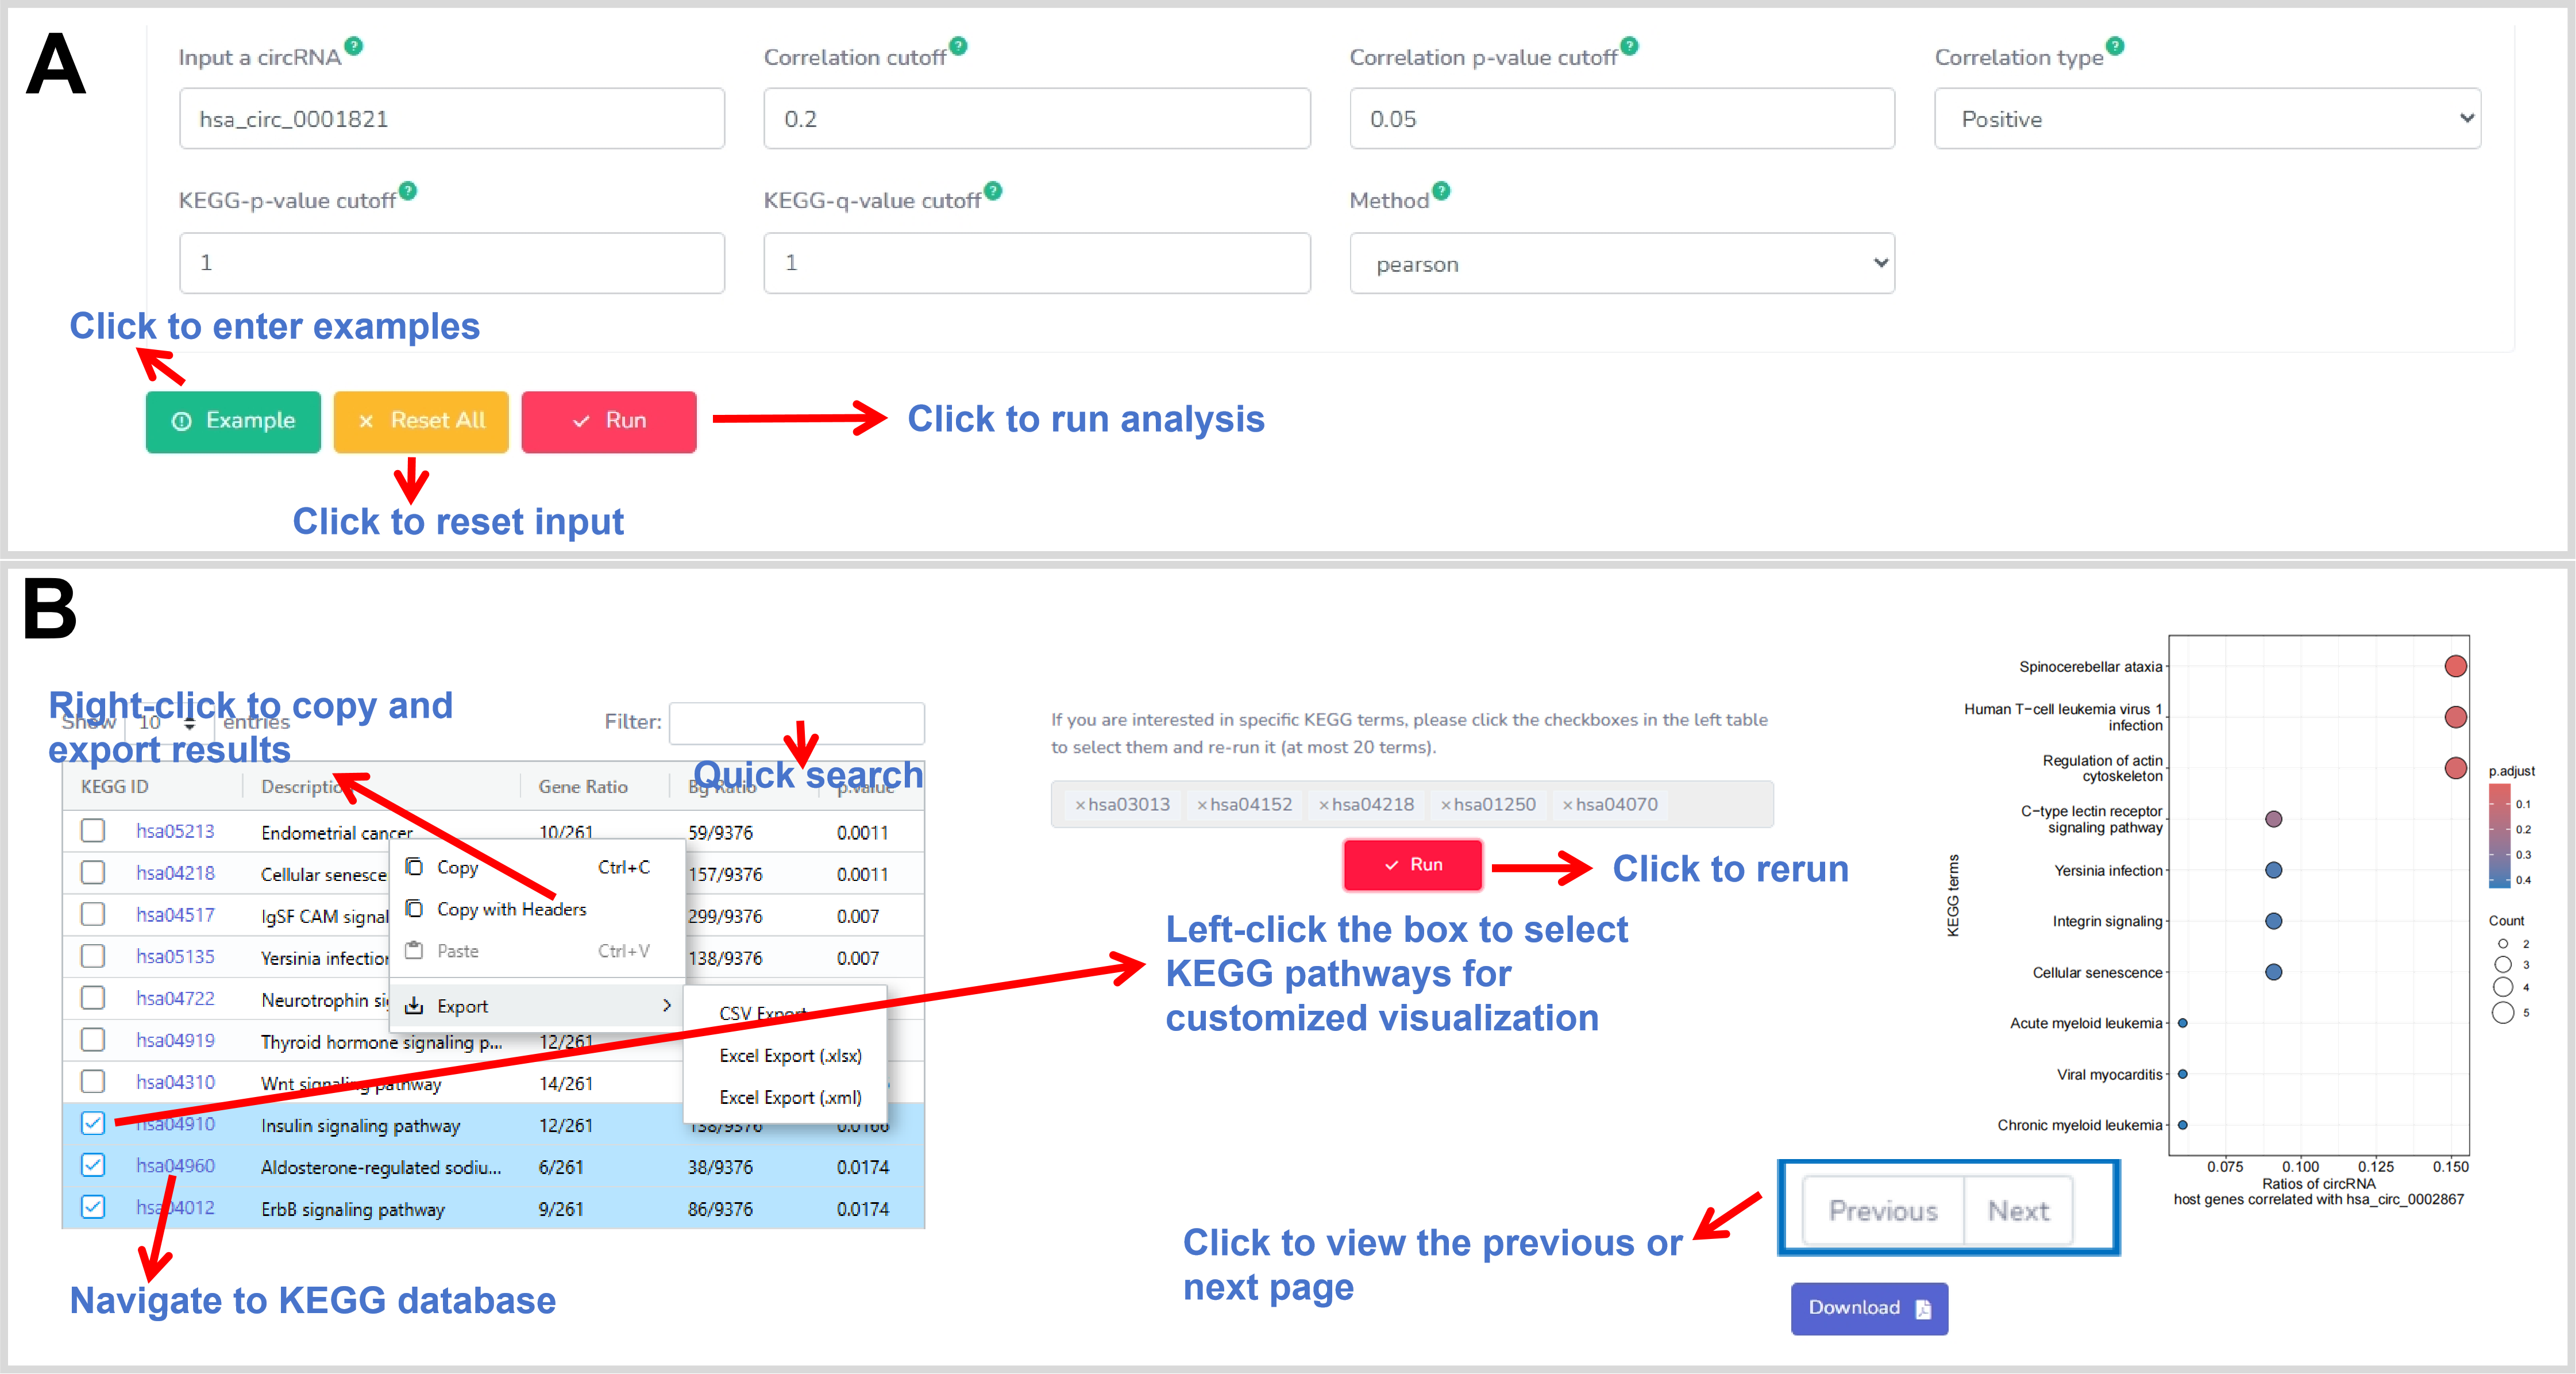
Figure 46. The web interface of the KEGG.
16. OncoCircVar
This module provides overall 674,264 genomic variants associating with 63,879 circRNAs across 33 cancer subtypes and projects of The Cancer Genome Atlas (TCGA) Program, and further provides function of survival analysis on these data for discovering and identifying cancer biomarkers and targets of the circRNAs and their associated genomic variants. The module is designed to allow users for custom analysis and visualization based on the sample metadata (Figure 47).
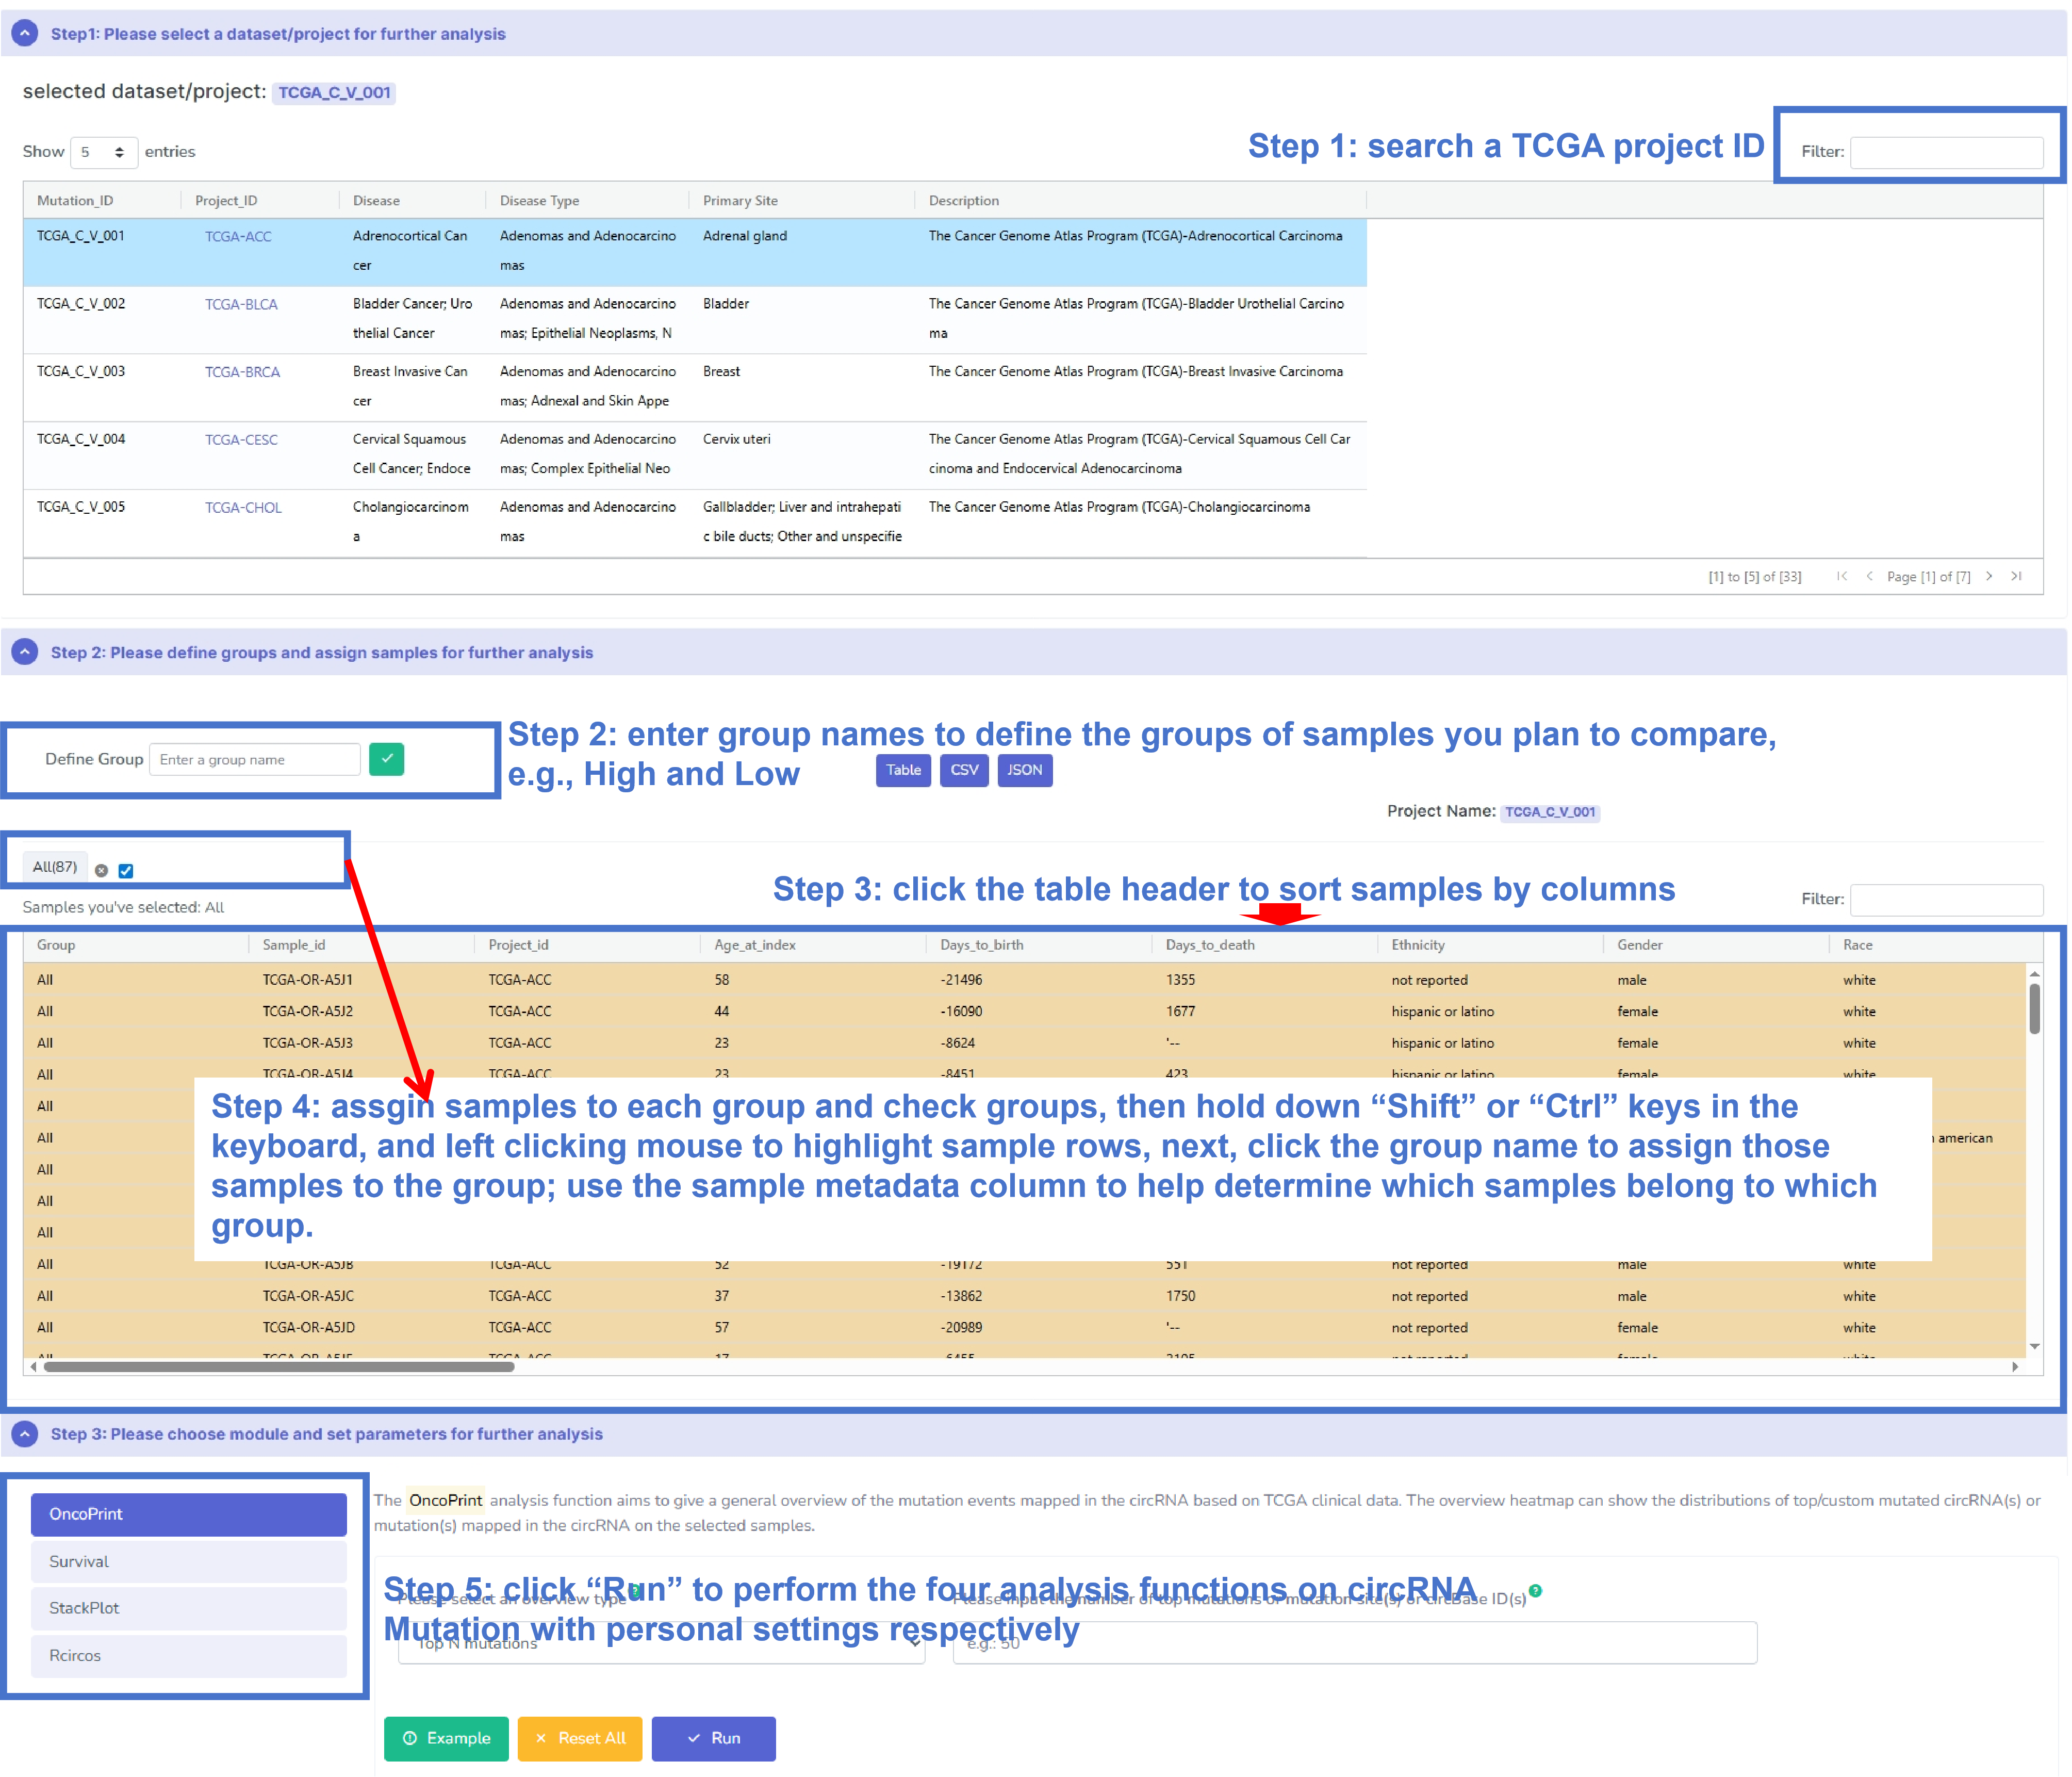
Figure 47.The web interface of the OncoCircVar.
Description: The OncoPrint analysis function aims to give a
general overview of the circRNA-associated genomic variants based on TCGA
clinical data. The result displays as a heatmap plot, which can be freely downloaded
and saved as a PDF file with high resolution (Figure 48).
R package(s): The dplyr, stringr, Matrix packages are used for the
data processes. The ComplexHeatmap and circlize are used for the heatmap plot.
Parameter(s):Please select an overview type:Select top variants or certain variant sites or circRNAs for visualization. The circRNAs and sites are limited in the range of the collected circRNAs and their associated genomic variants here;Please input the number of top variants or variant site(s) or circBase ID(s):Input number when select “Top N variants”; input circBase ID with hg38 position, the reference and the mutated nucleotide when select “Variant sites”; input circBase ID when select “circRNA”.
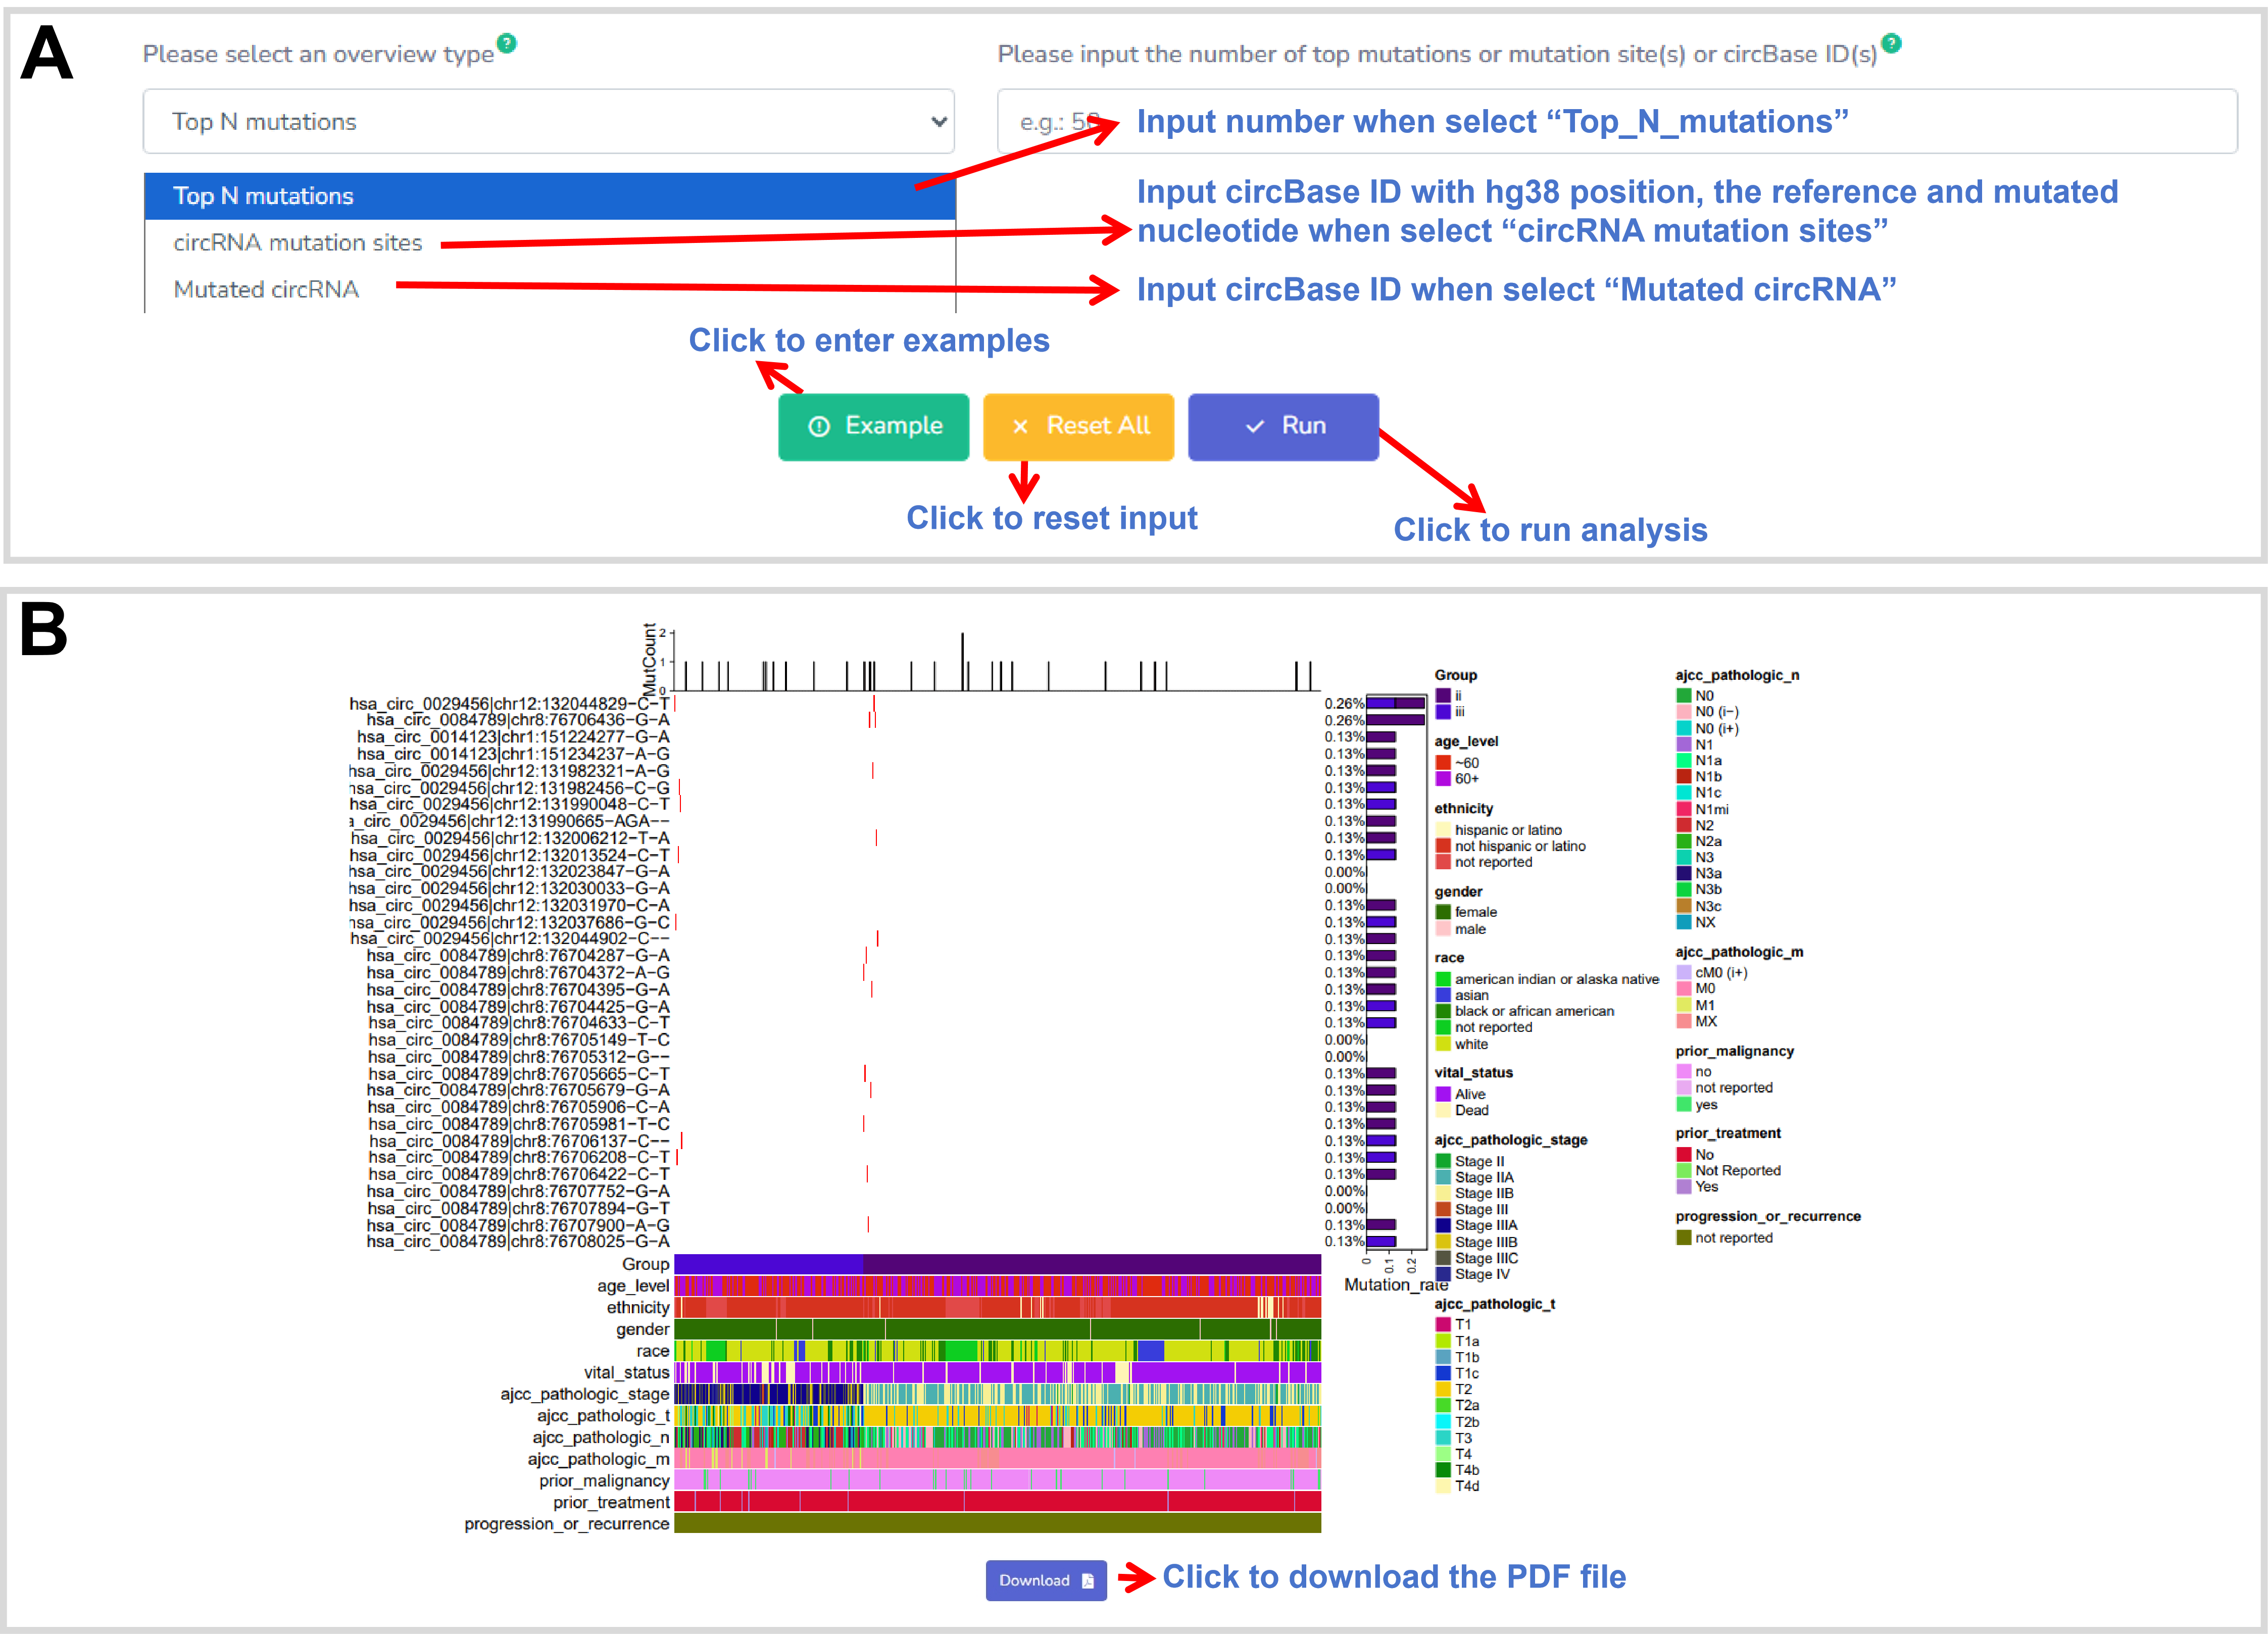
Figure 48. The web interface of the OncoPrint.
Description: The Survival analysis function aims to perform a survival
analysis based on the selected TCGA data set with outputing a survival plot
according to the interesting circRNA-associated genomic variant or a circRNA co-located with genomic variant(s) (Figure 49).
R package(s):The dplyr, stringr, jsonlite and limma packages are used
for the data processes. The survival and survminer packages are used for the
survival analysis and plot.
Parameter(s):Please select variant site or circRNA:Select a input type;Please input a variant site or circBase ID:Input circBase ID with hg38 position, the reference and the altered nucleotide when select “Variant sites”; input circBase ID when select “circRNA”. The circRNAs and sites are limited in the range of the collected circRNAs and their associated genomic variants here.
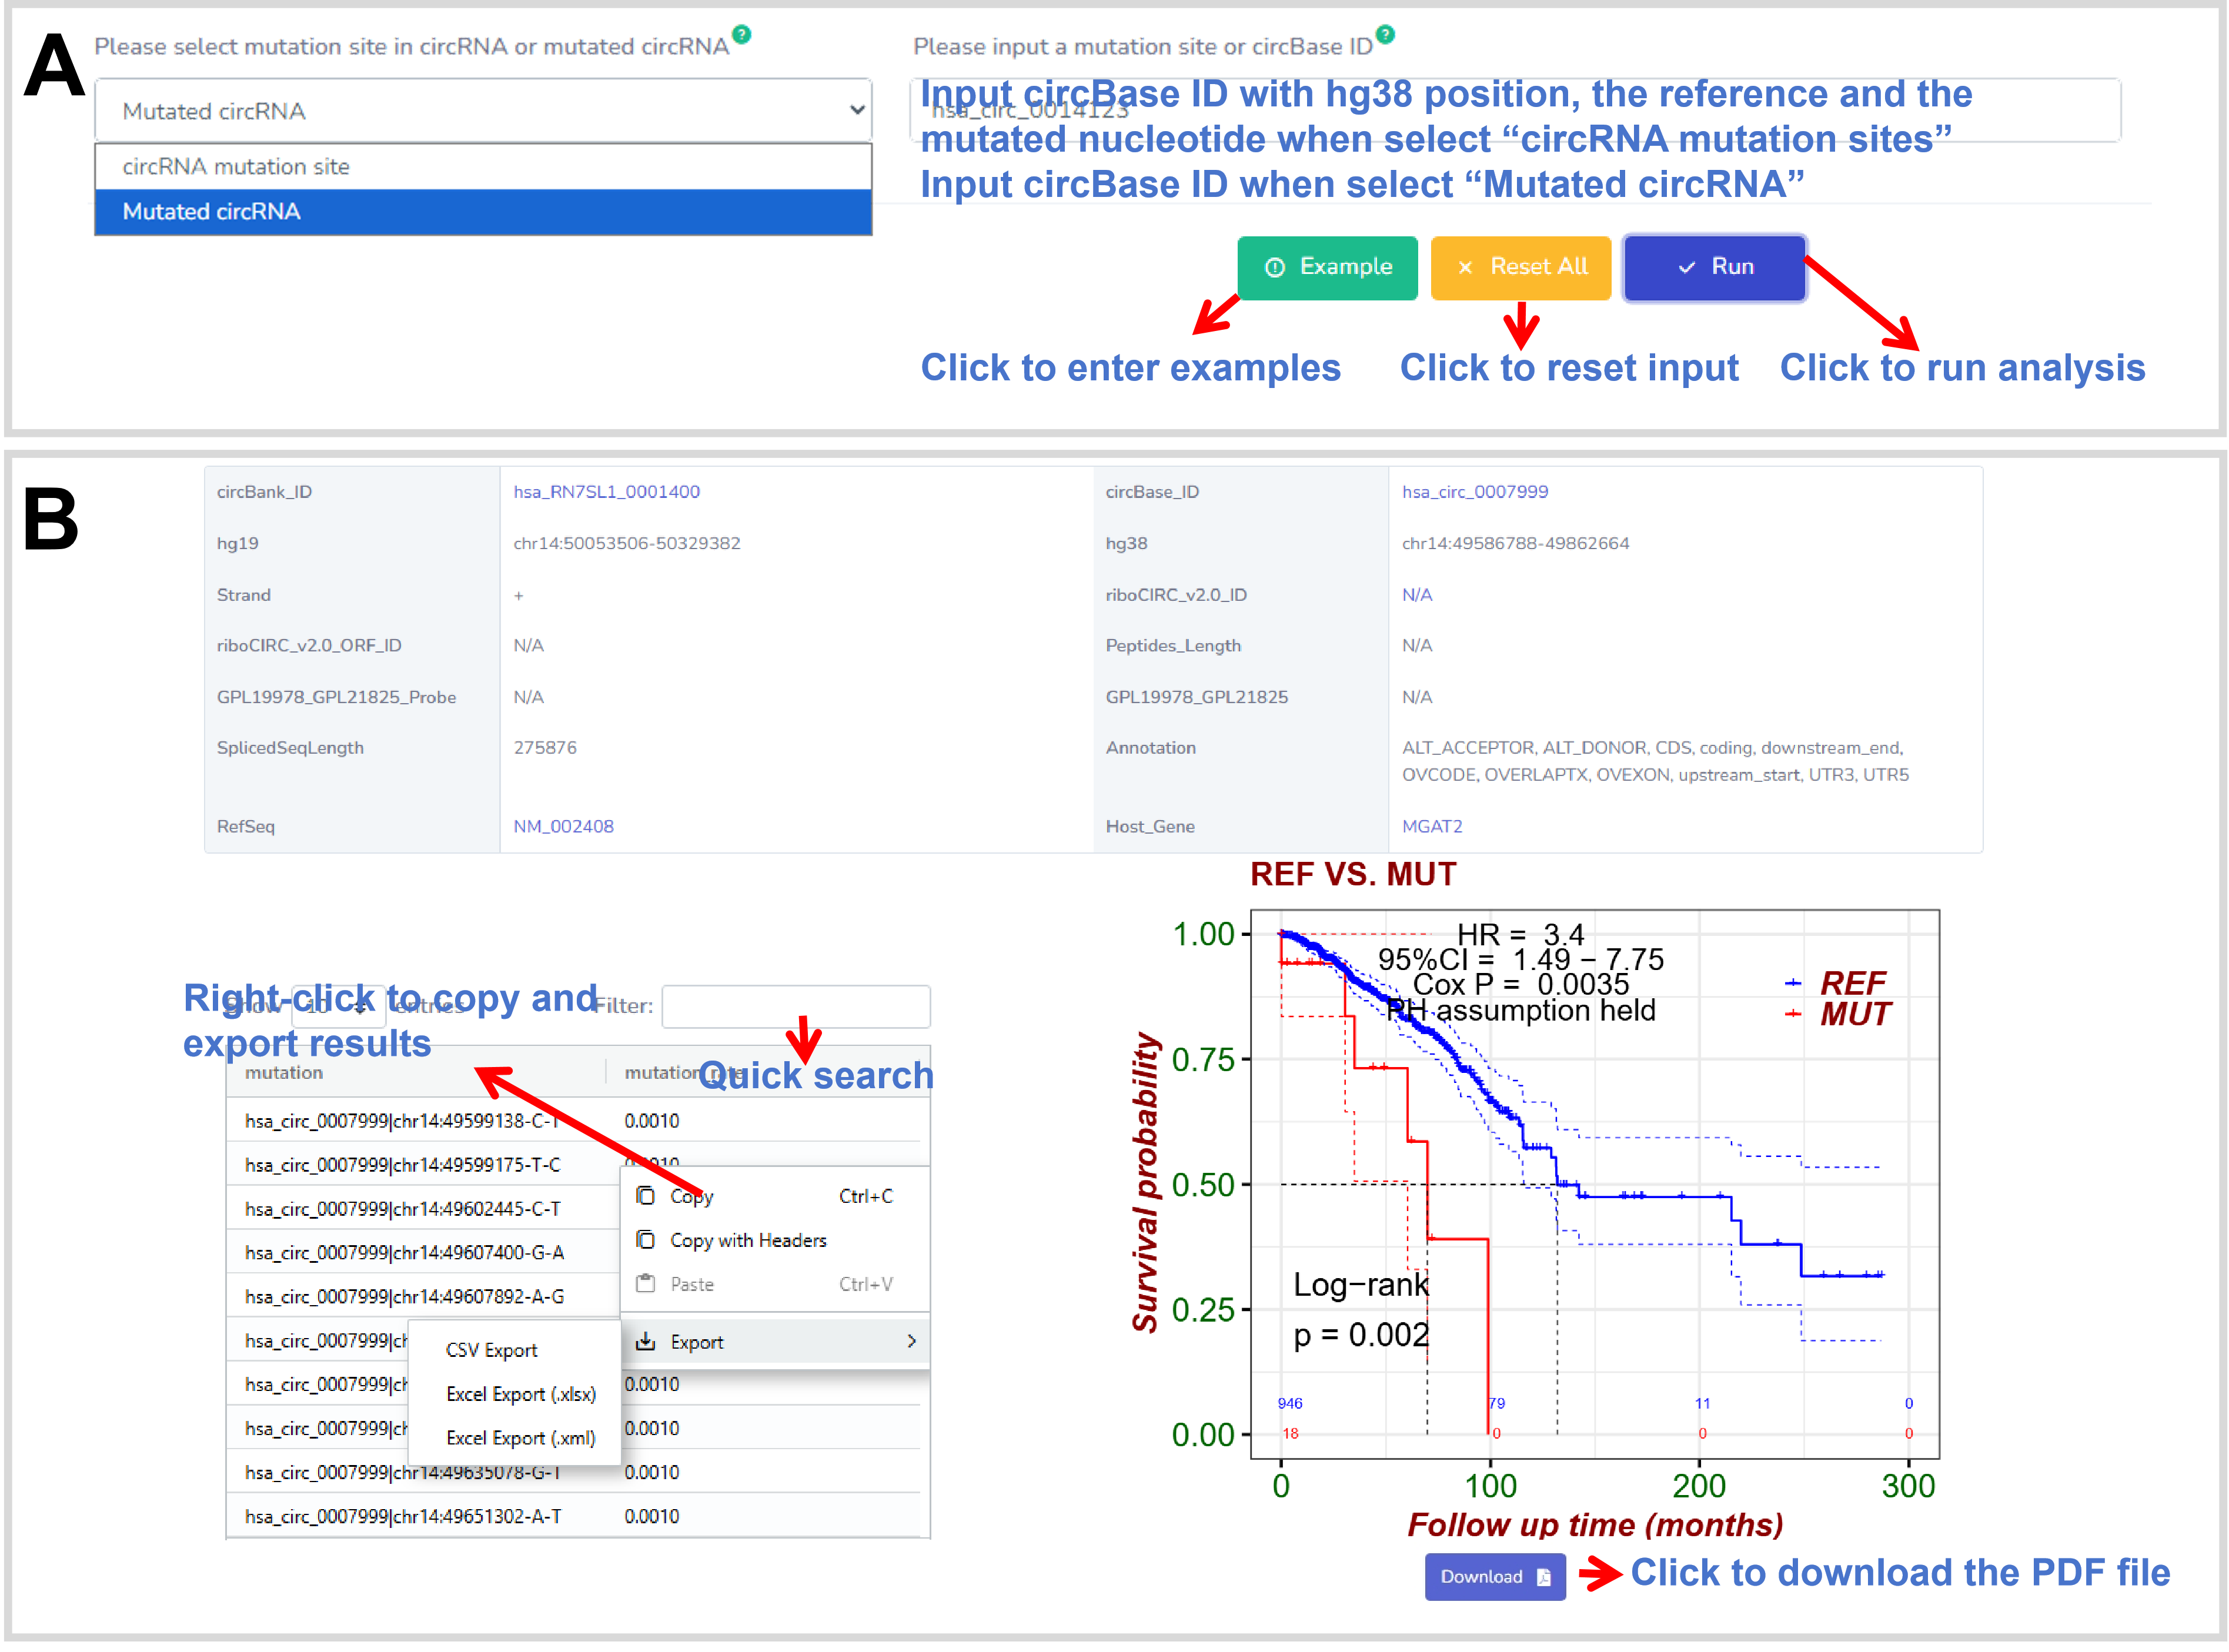
Figure 49. The web interface of the Survival.
Description:
The StackPlot analysis function aims to show the distributions of a circRNA-associated genomic variant
site or a circRNA co-located with genomic variants between or among different groups, which were defined by the user.
(Figure 50).
R packages:The dplyr, stringr, jsonlite and limma packages are used
for the data processes. The ggplot2 and patchwork packages are used for the stack
plot.
Parameter(s):Please select circRNA-associated genomic variant or circRNA co-located with genomic variants:Select a input type;Please input a variant site or circBase ID:Input circBase ID with hg38 position, the reference and the altered nucleotide when select “Variant sites”; input circBase ID when select “circRNA”.
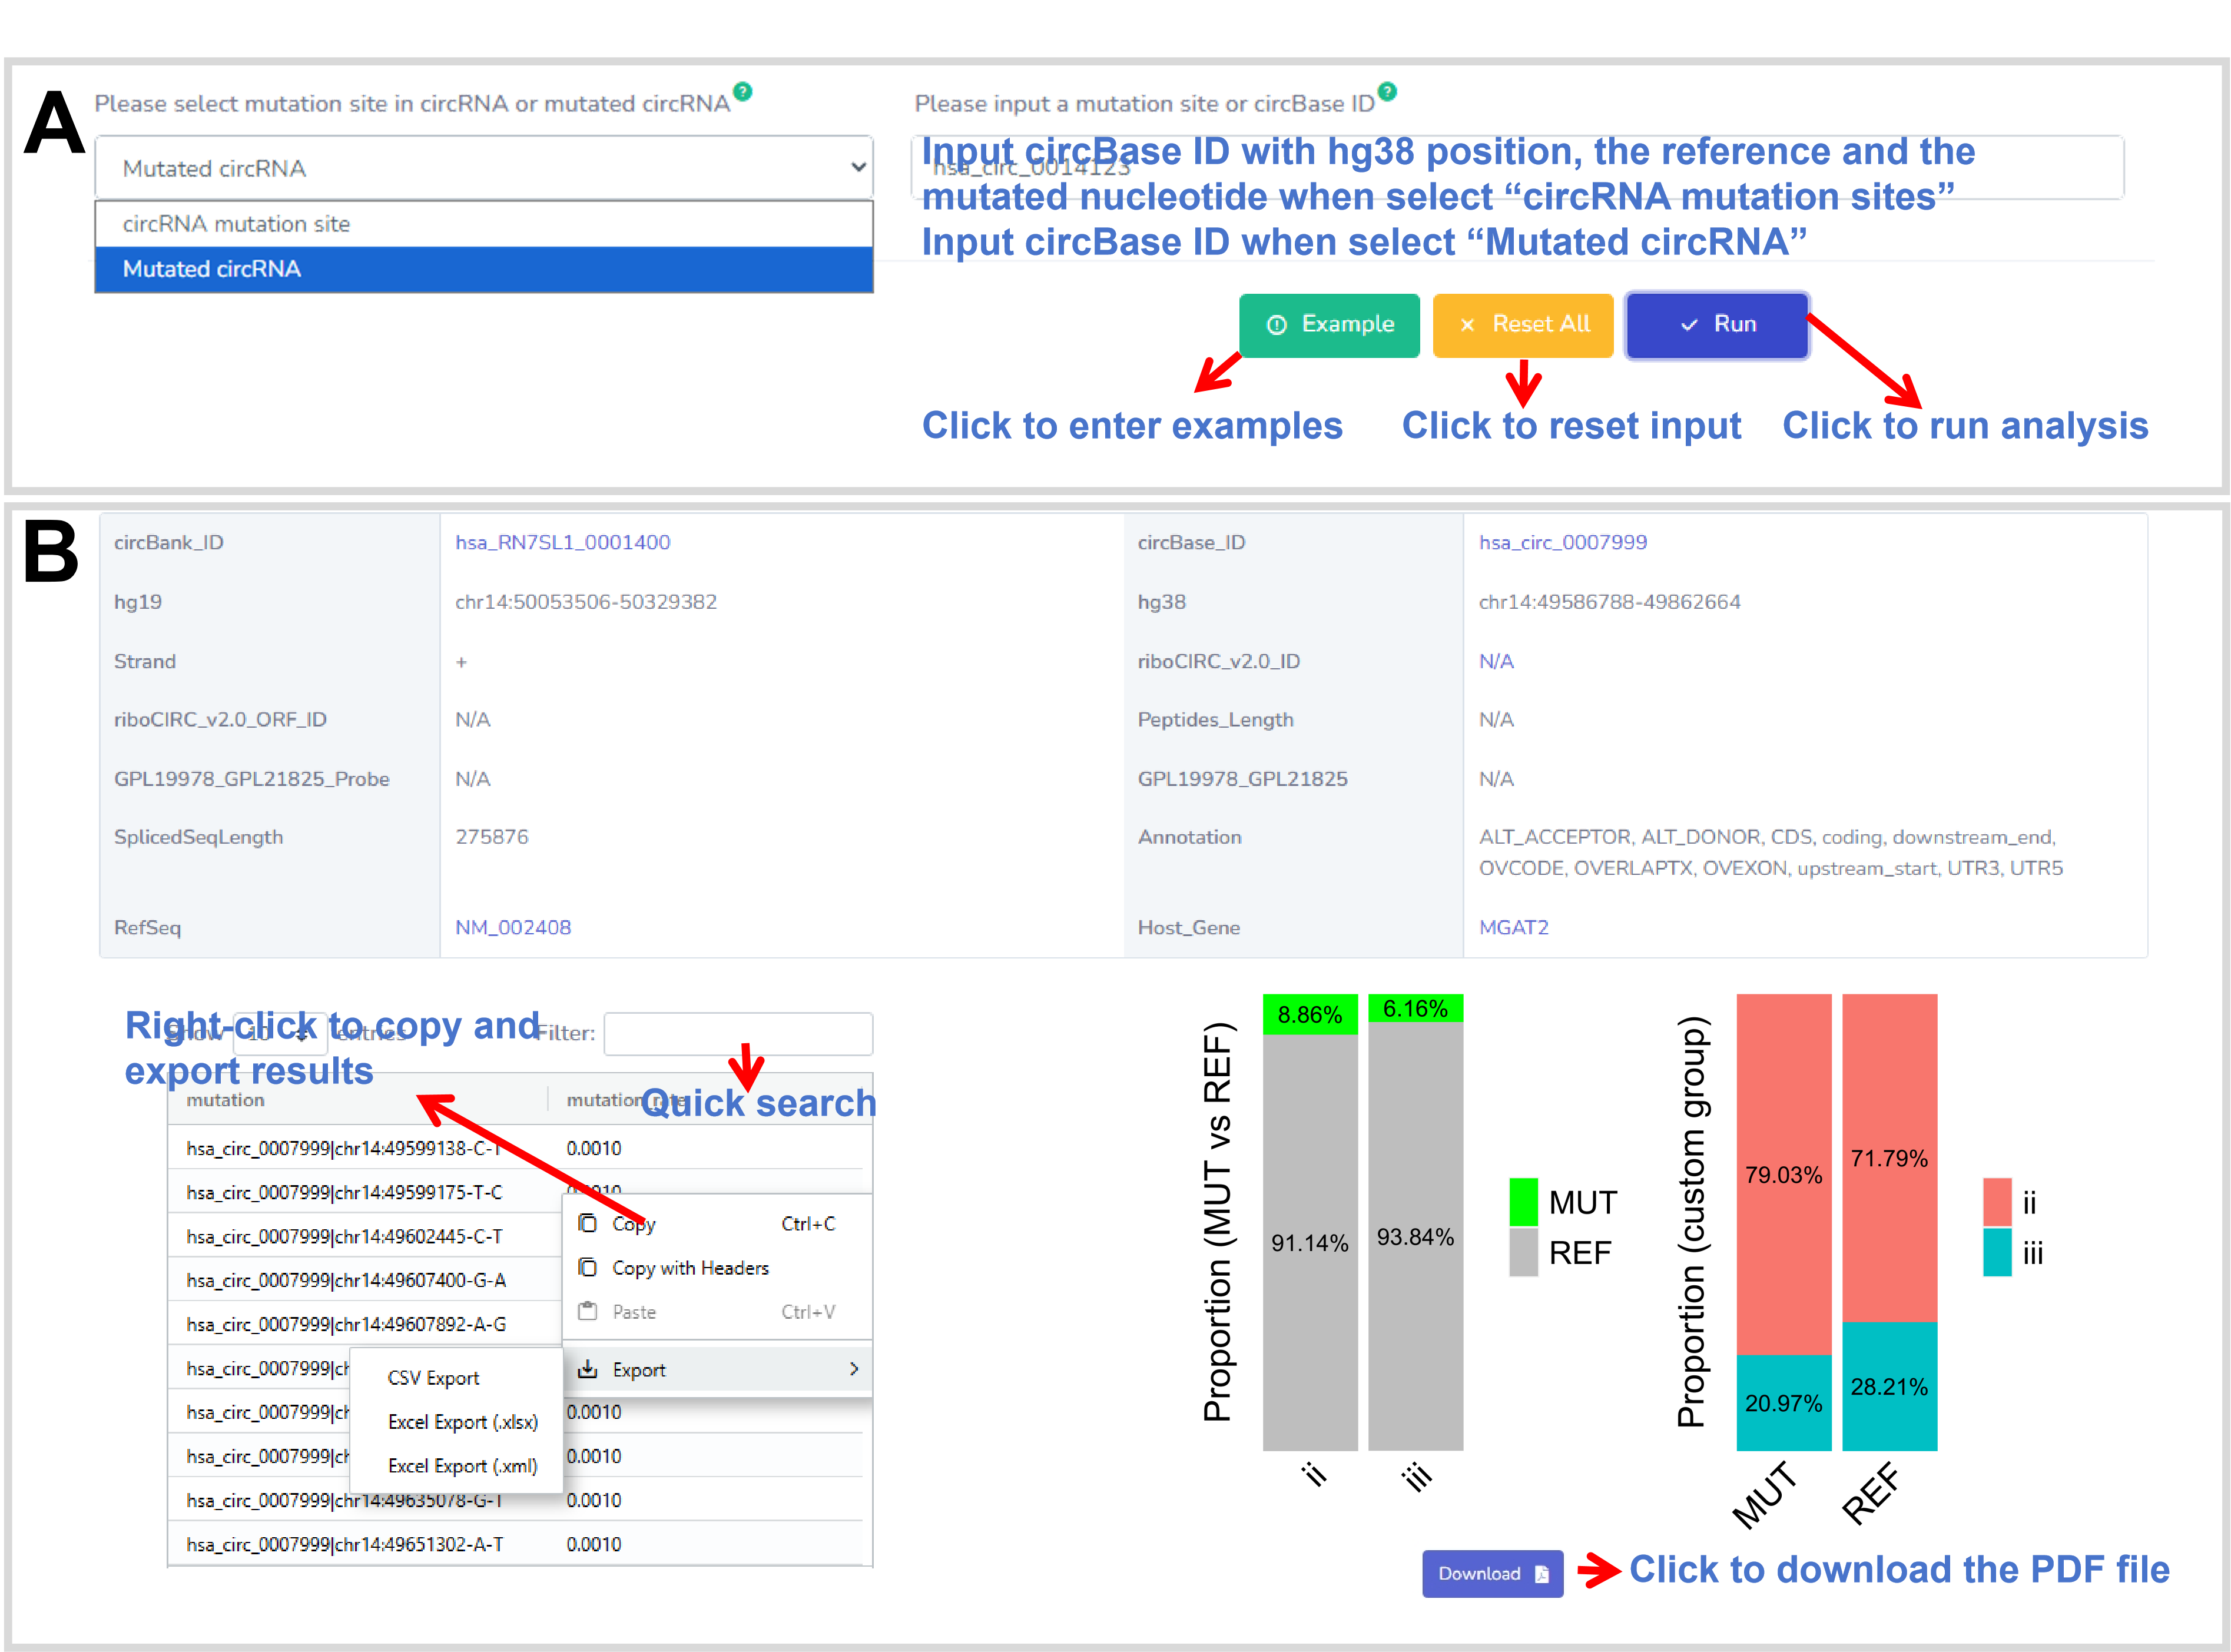
Figure 50. The web interface of the StackPlot.
Description:
The Rcircos analysis function aims to show the chromosomal locations of the top/custom circRNAs involving genomic variants
along the human genome (hg38) in each users-defined group and the shared circRNA-associated
genomic variant site(s) in all of users-defined groups. Tips: it is recommended that the
number of the inputs does not exceed 20, and that two groups are used (Figure
51).
R package(s): The dplyr, stringr, tidyr, jsonlite and limma packages
are used for the data processes. The circlize, ComplexHeatmap and GenomicRanges
packages are used for the circos plot of the hg38.
Parameter(s): Please select an overview type:Select top variants or certain variant sites or circRNAs for visualization. The circRNAs and sites are limited in the range of the collected circRNAs and their associated genomic variants here;Please input the number of top variants or variant site(s) or circBase ID(s):Input number when select “Top N variants”; input circBase ID with hg38 position, the reference and the mutated nucleotide when select “Variant sites”; input circBase ID when select “circRNA”.
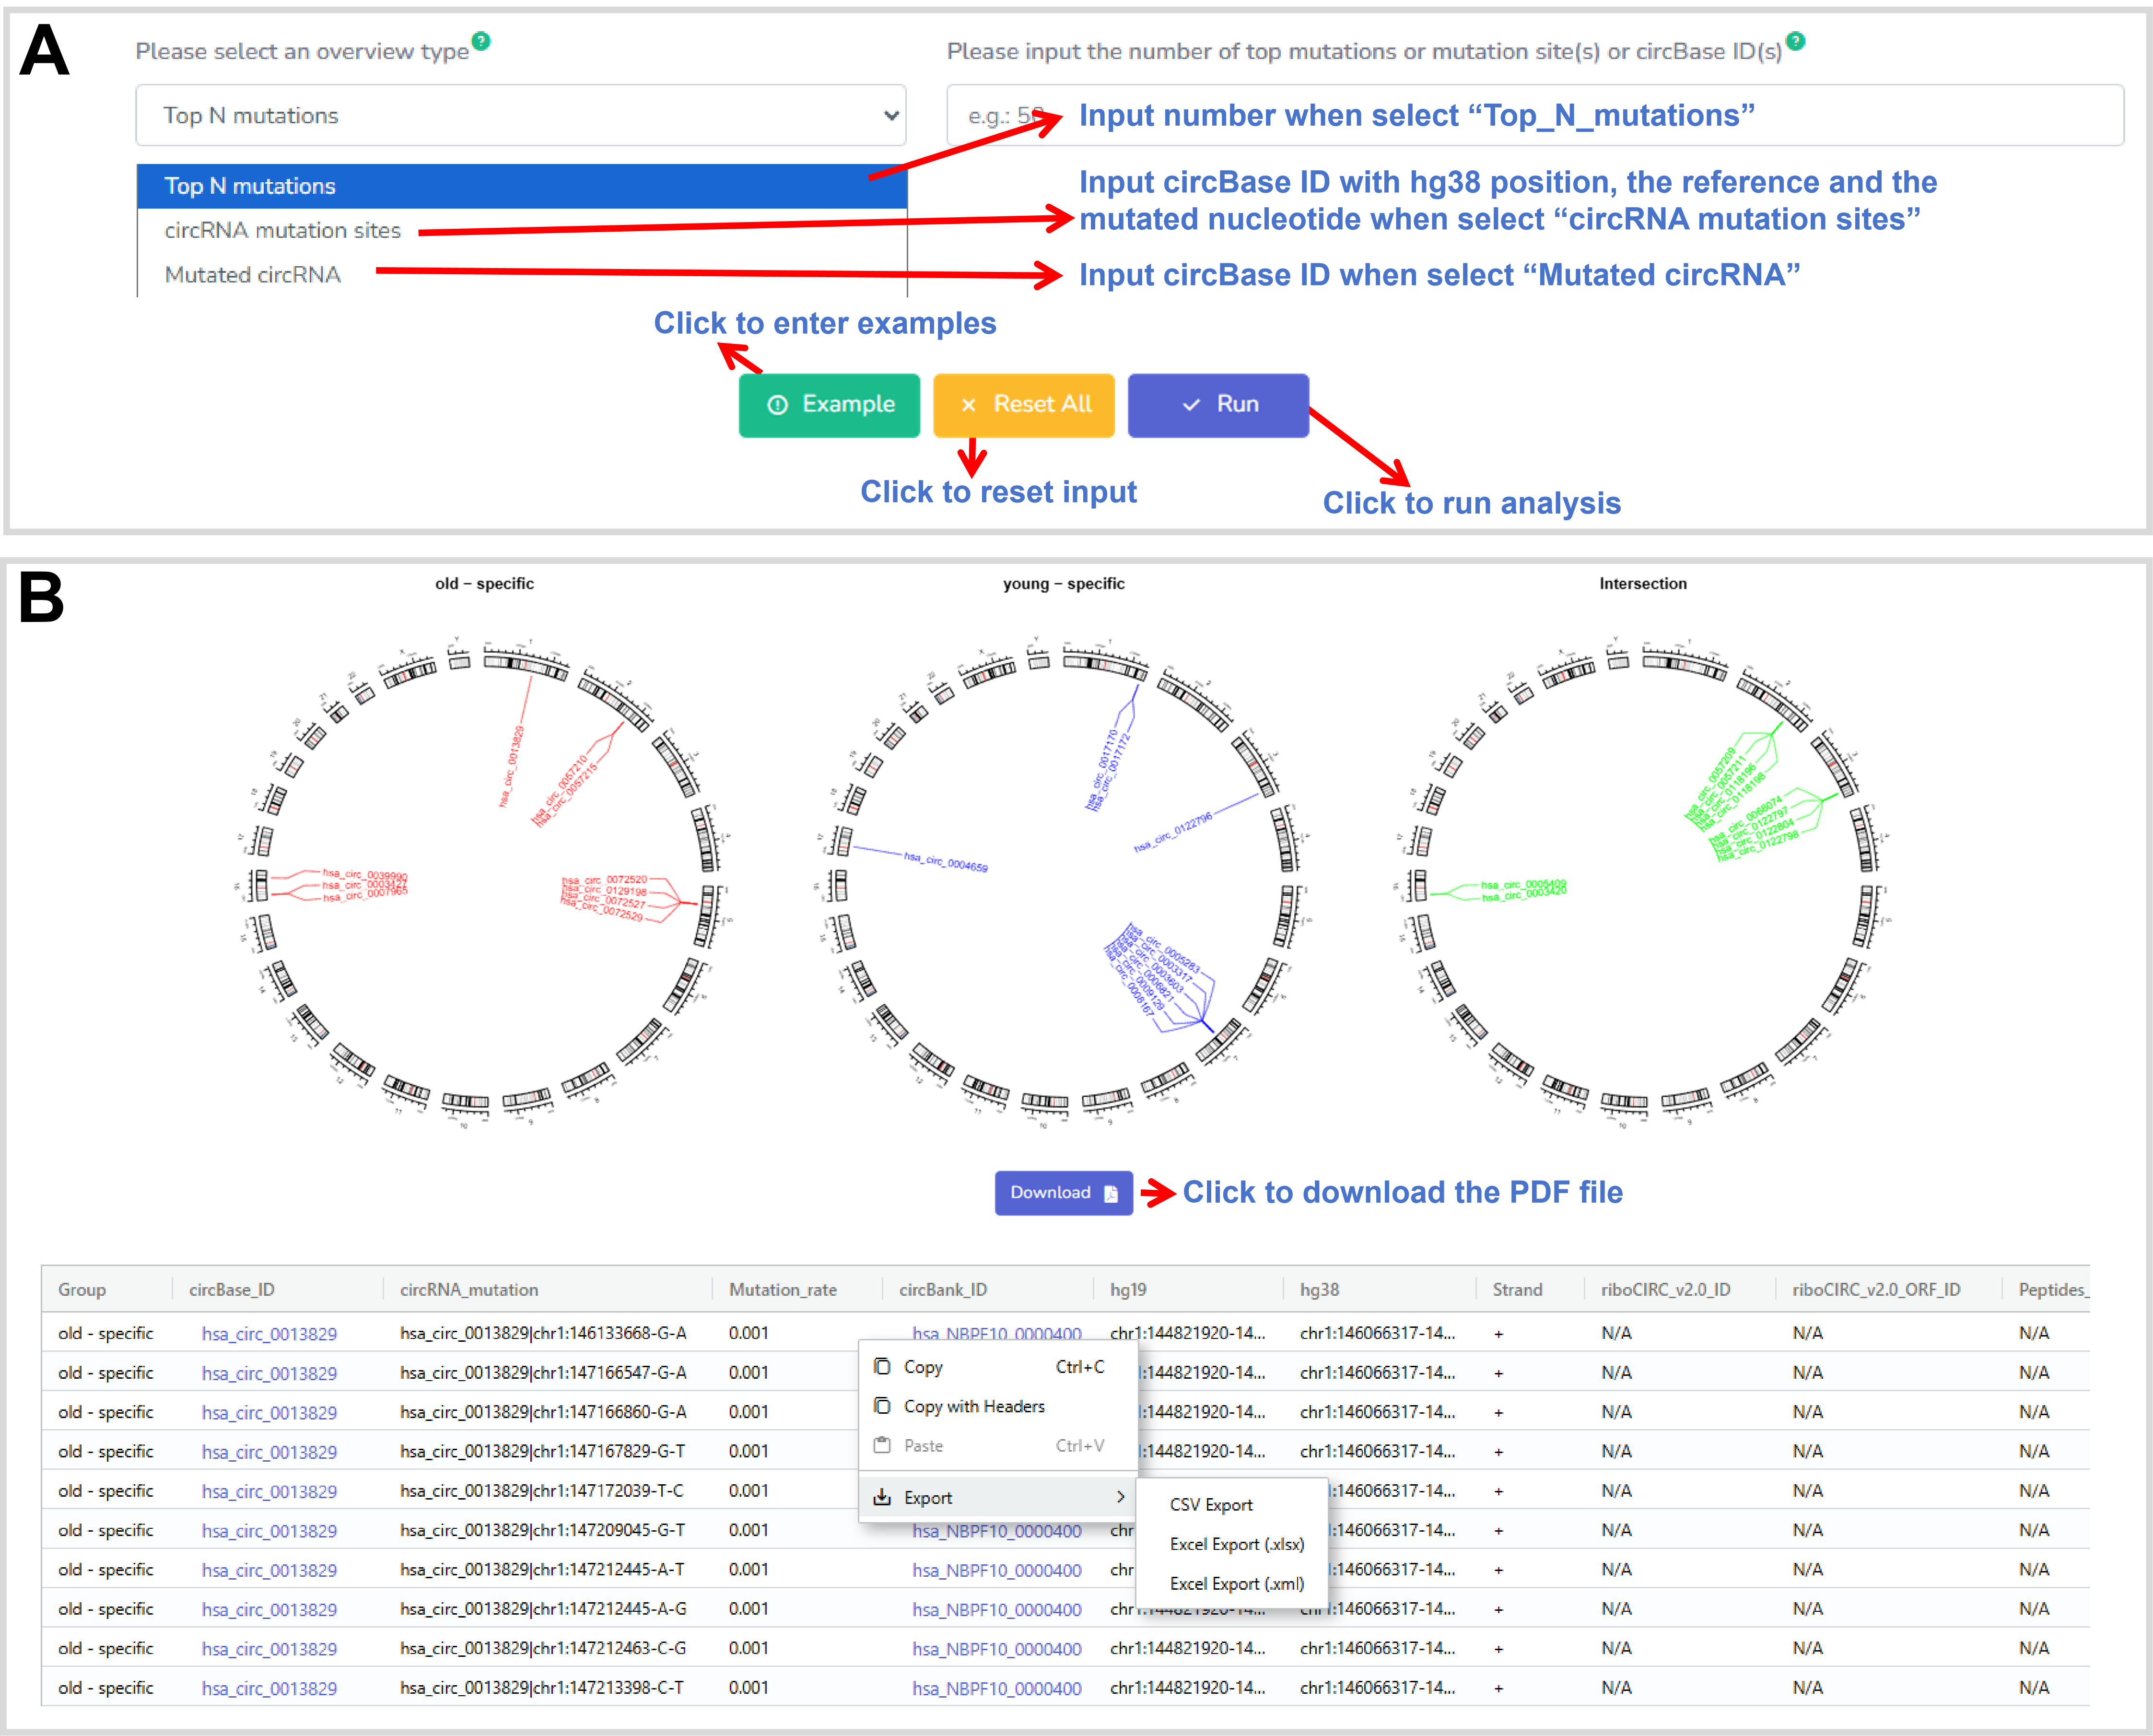
Figure 51. The web interface of the Rcircos.
17. Translatable circRNA
The Translatable circRNA module enables users to query potentially translatable circRNAs of interest using identifiers from circBase_ID, circBank_ID, or riboCIRC_v2.0_ID. It integrates genomic annotations, DeepLoc-predicted subcellular localization, and AlphaFold2-derived tertiary structures of circRNA-encoded proteins, thereby providing a comprehensive resource for functional characterization (Figure 52).
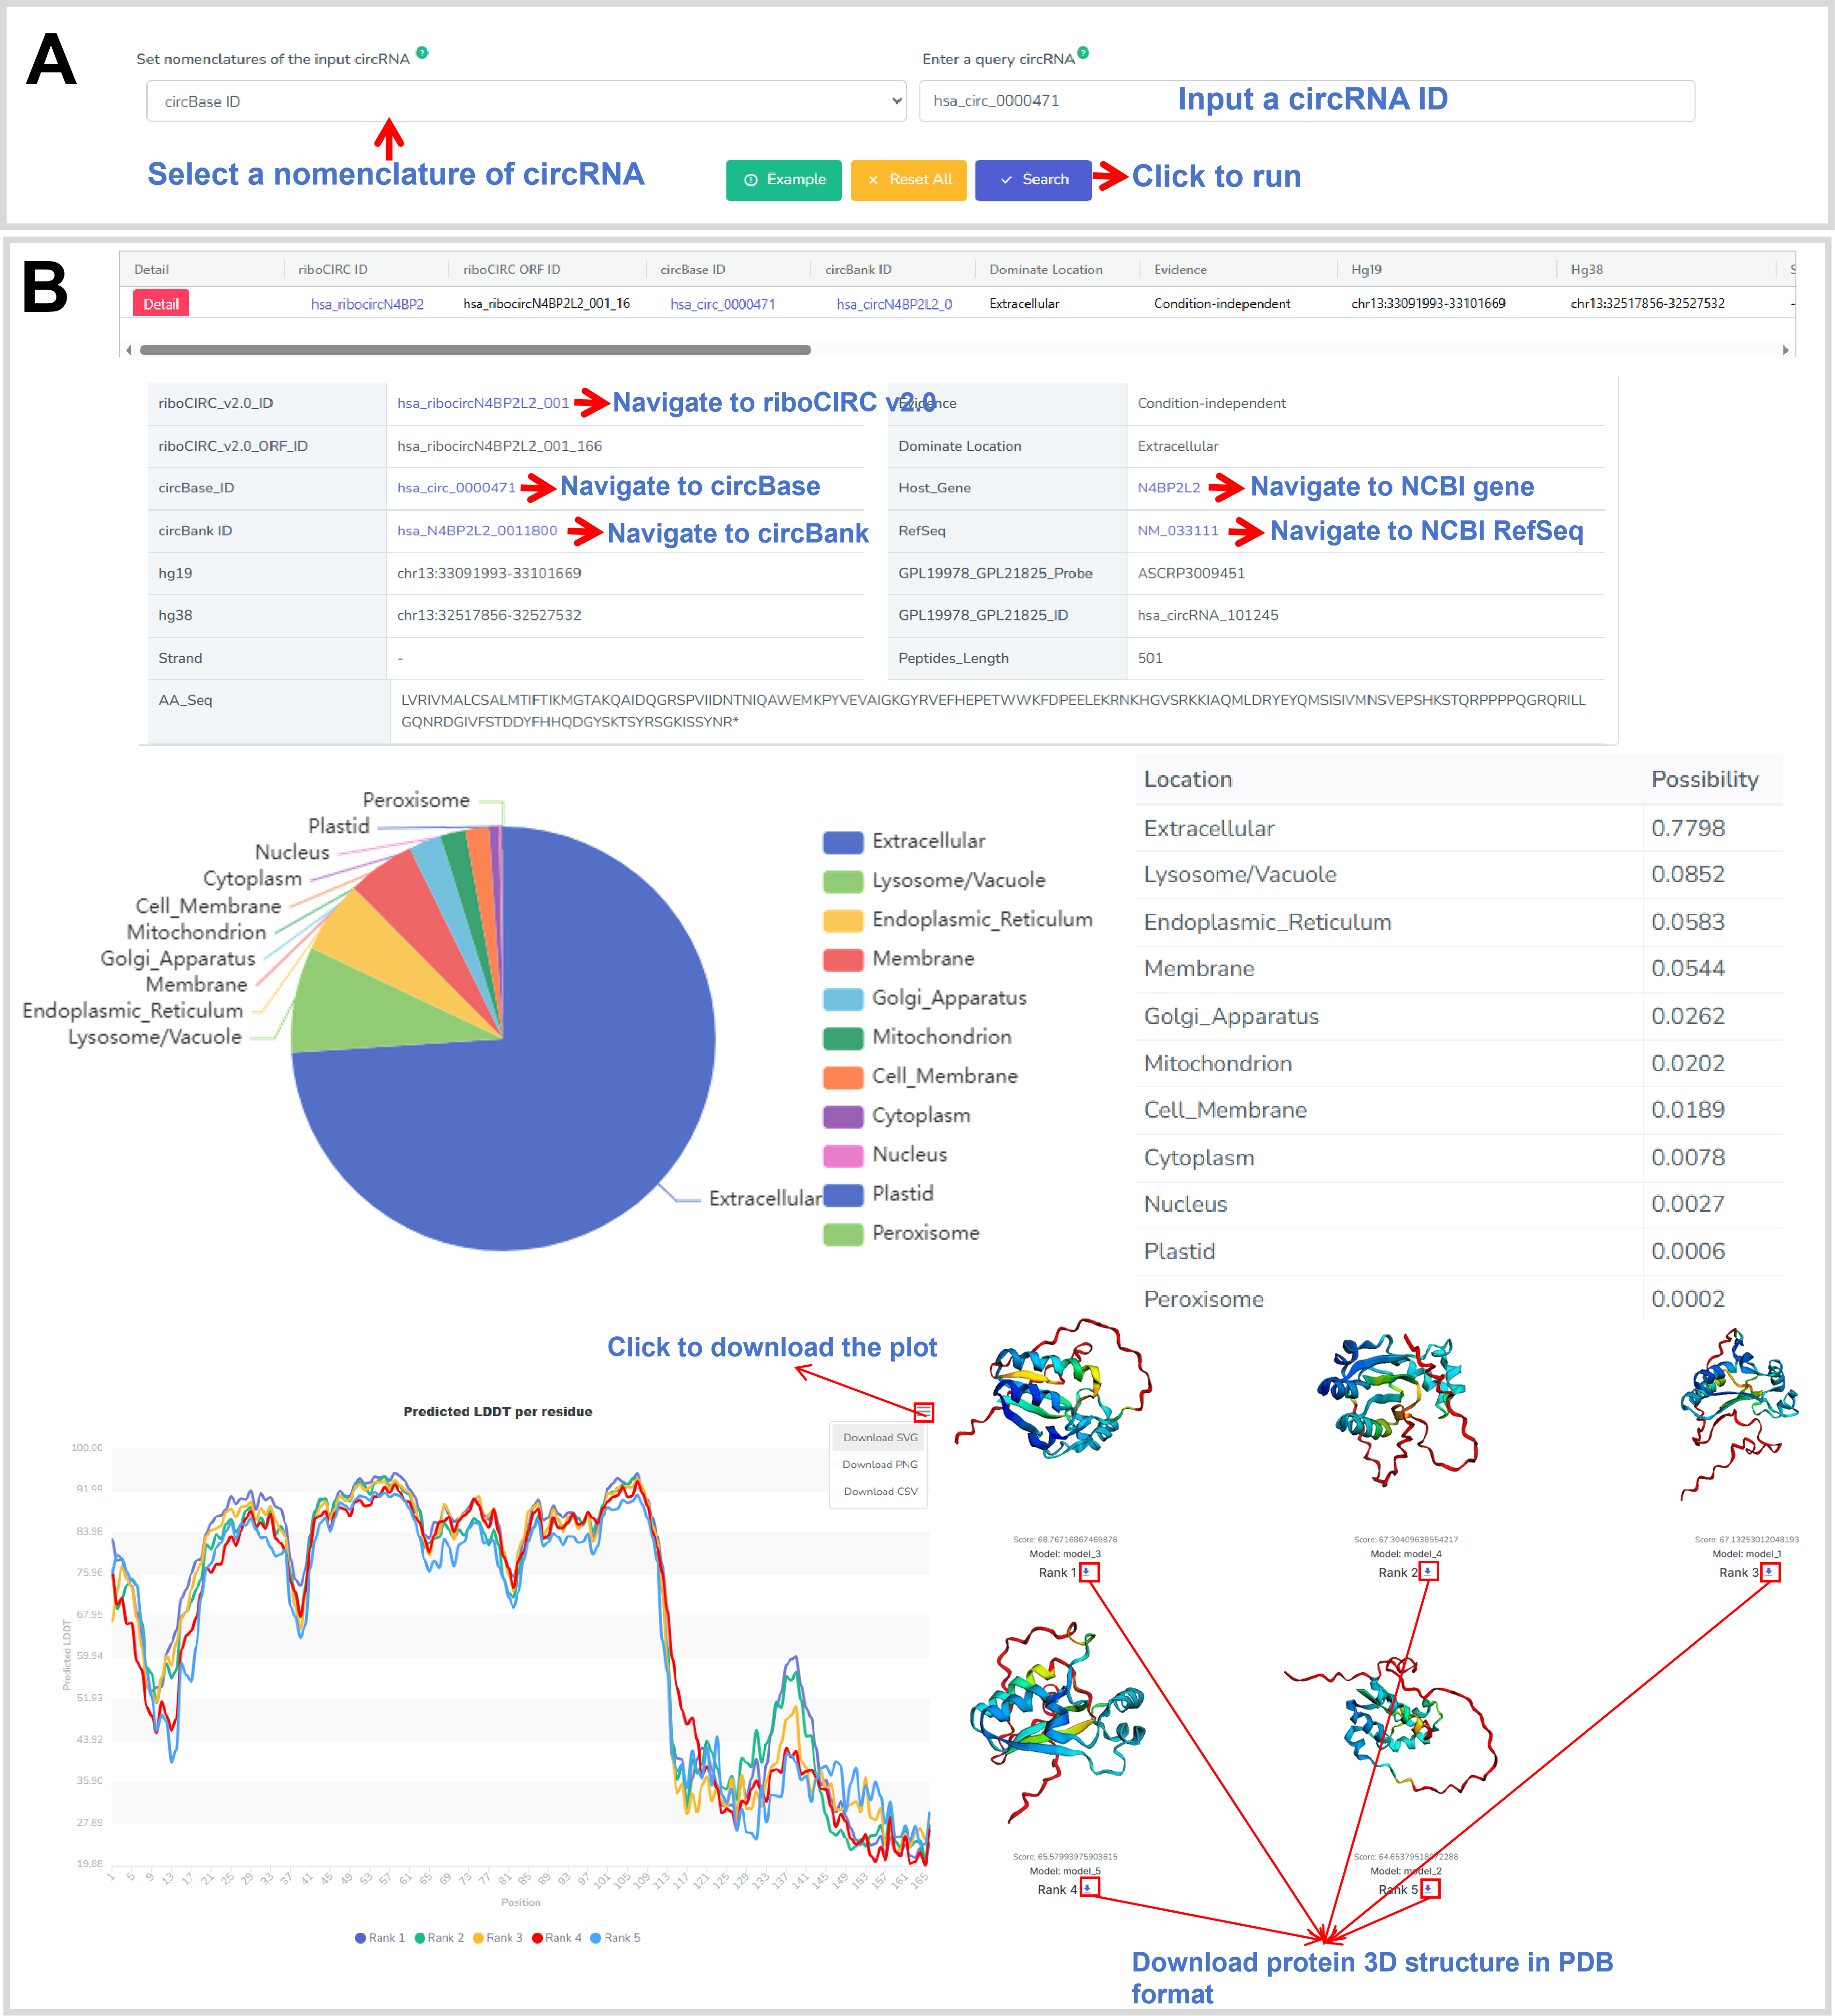
Figure 52. The web interface of the Translatable circRNA.
18. Web Server
For bench scientists without bioinformatics skills, it is very difficult to investigate
their own circRNA transcriptomic data generated by high throughput platform. To cope with
this challenge and serve more communities, we established the Web Server application, which
offers opportunities for researchers to comprehensively investigate their own circRNA
transcriptomic data. The application is a systematic pipeline to automatically process the
circRNA transcriptomic data of various species and its sample information uploaded by
researchers. Moreover, the processed data will be saved and assigned with a temporary and
unique identifier for further analyses by themselves only. The further analyses include the
13 analyses in the differential expression and co-expression modules. In addition, in order
to better guarantee the data security, users can determine to delete the data uploaded by
themselves in any stage and we will also regularly clean up the data uploaded by users every
week.
Important: The first column in the sample information file uploaded by Step 2 must be the sample
identifiers (IDs) that are used in the circRNA expression data uploaded by Step 1 (Figure
53).
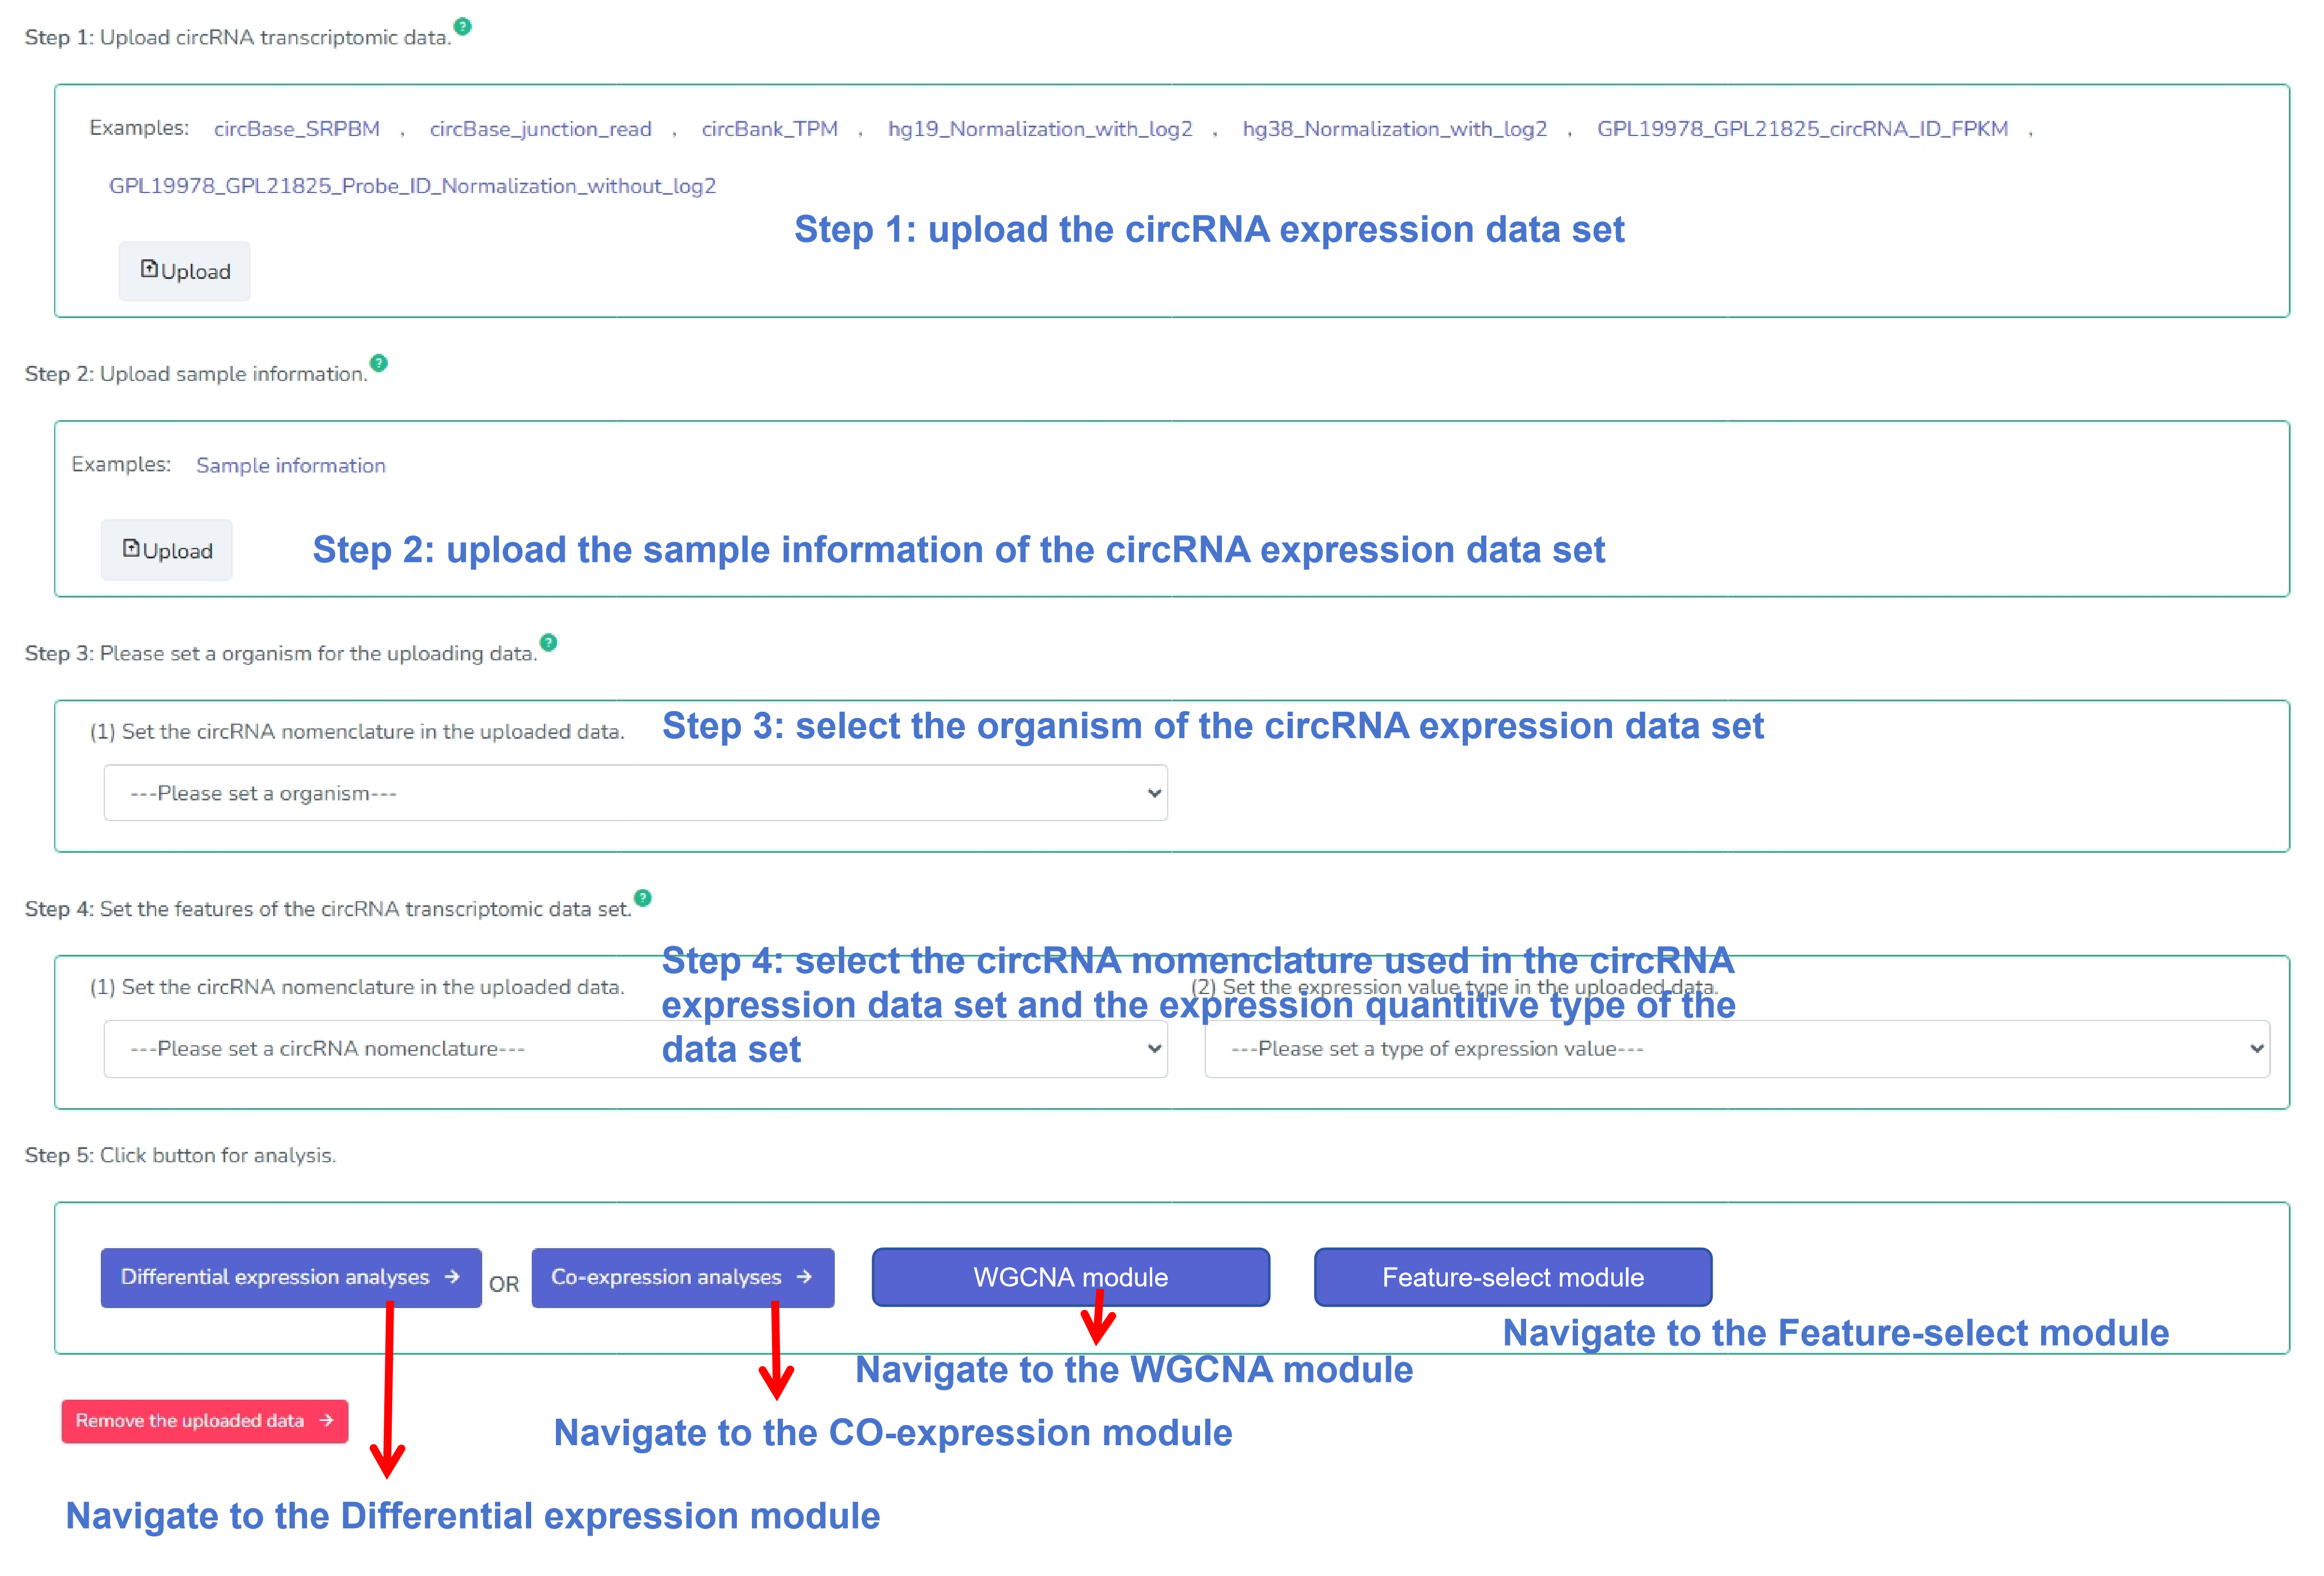
Figure 53. The web interface of the Web Server.
19. Submit
Researchers are encouraged to submit their new human circRNA transcriptomic data with its sample information to the database. Please fill in the form and upload the circRNA transcriptomic data with its sample information below to process the submission. The "*" symbol indicates the required fields (Figure 54).
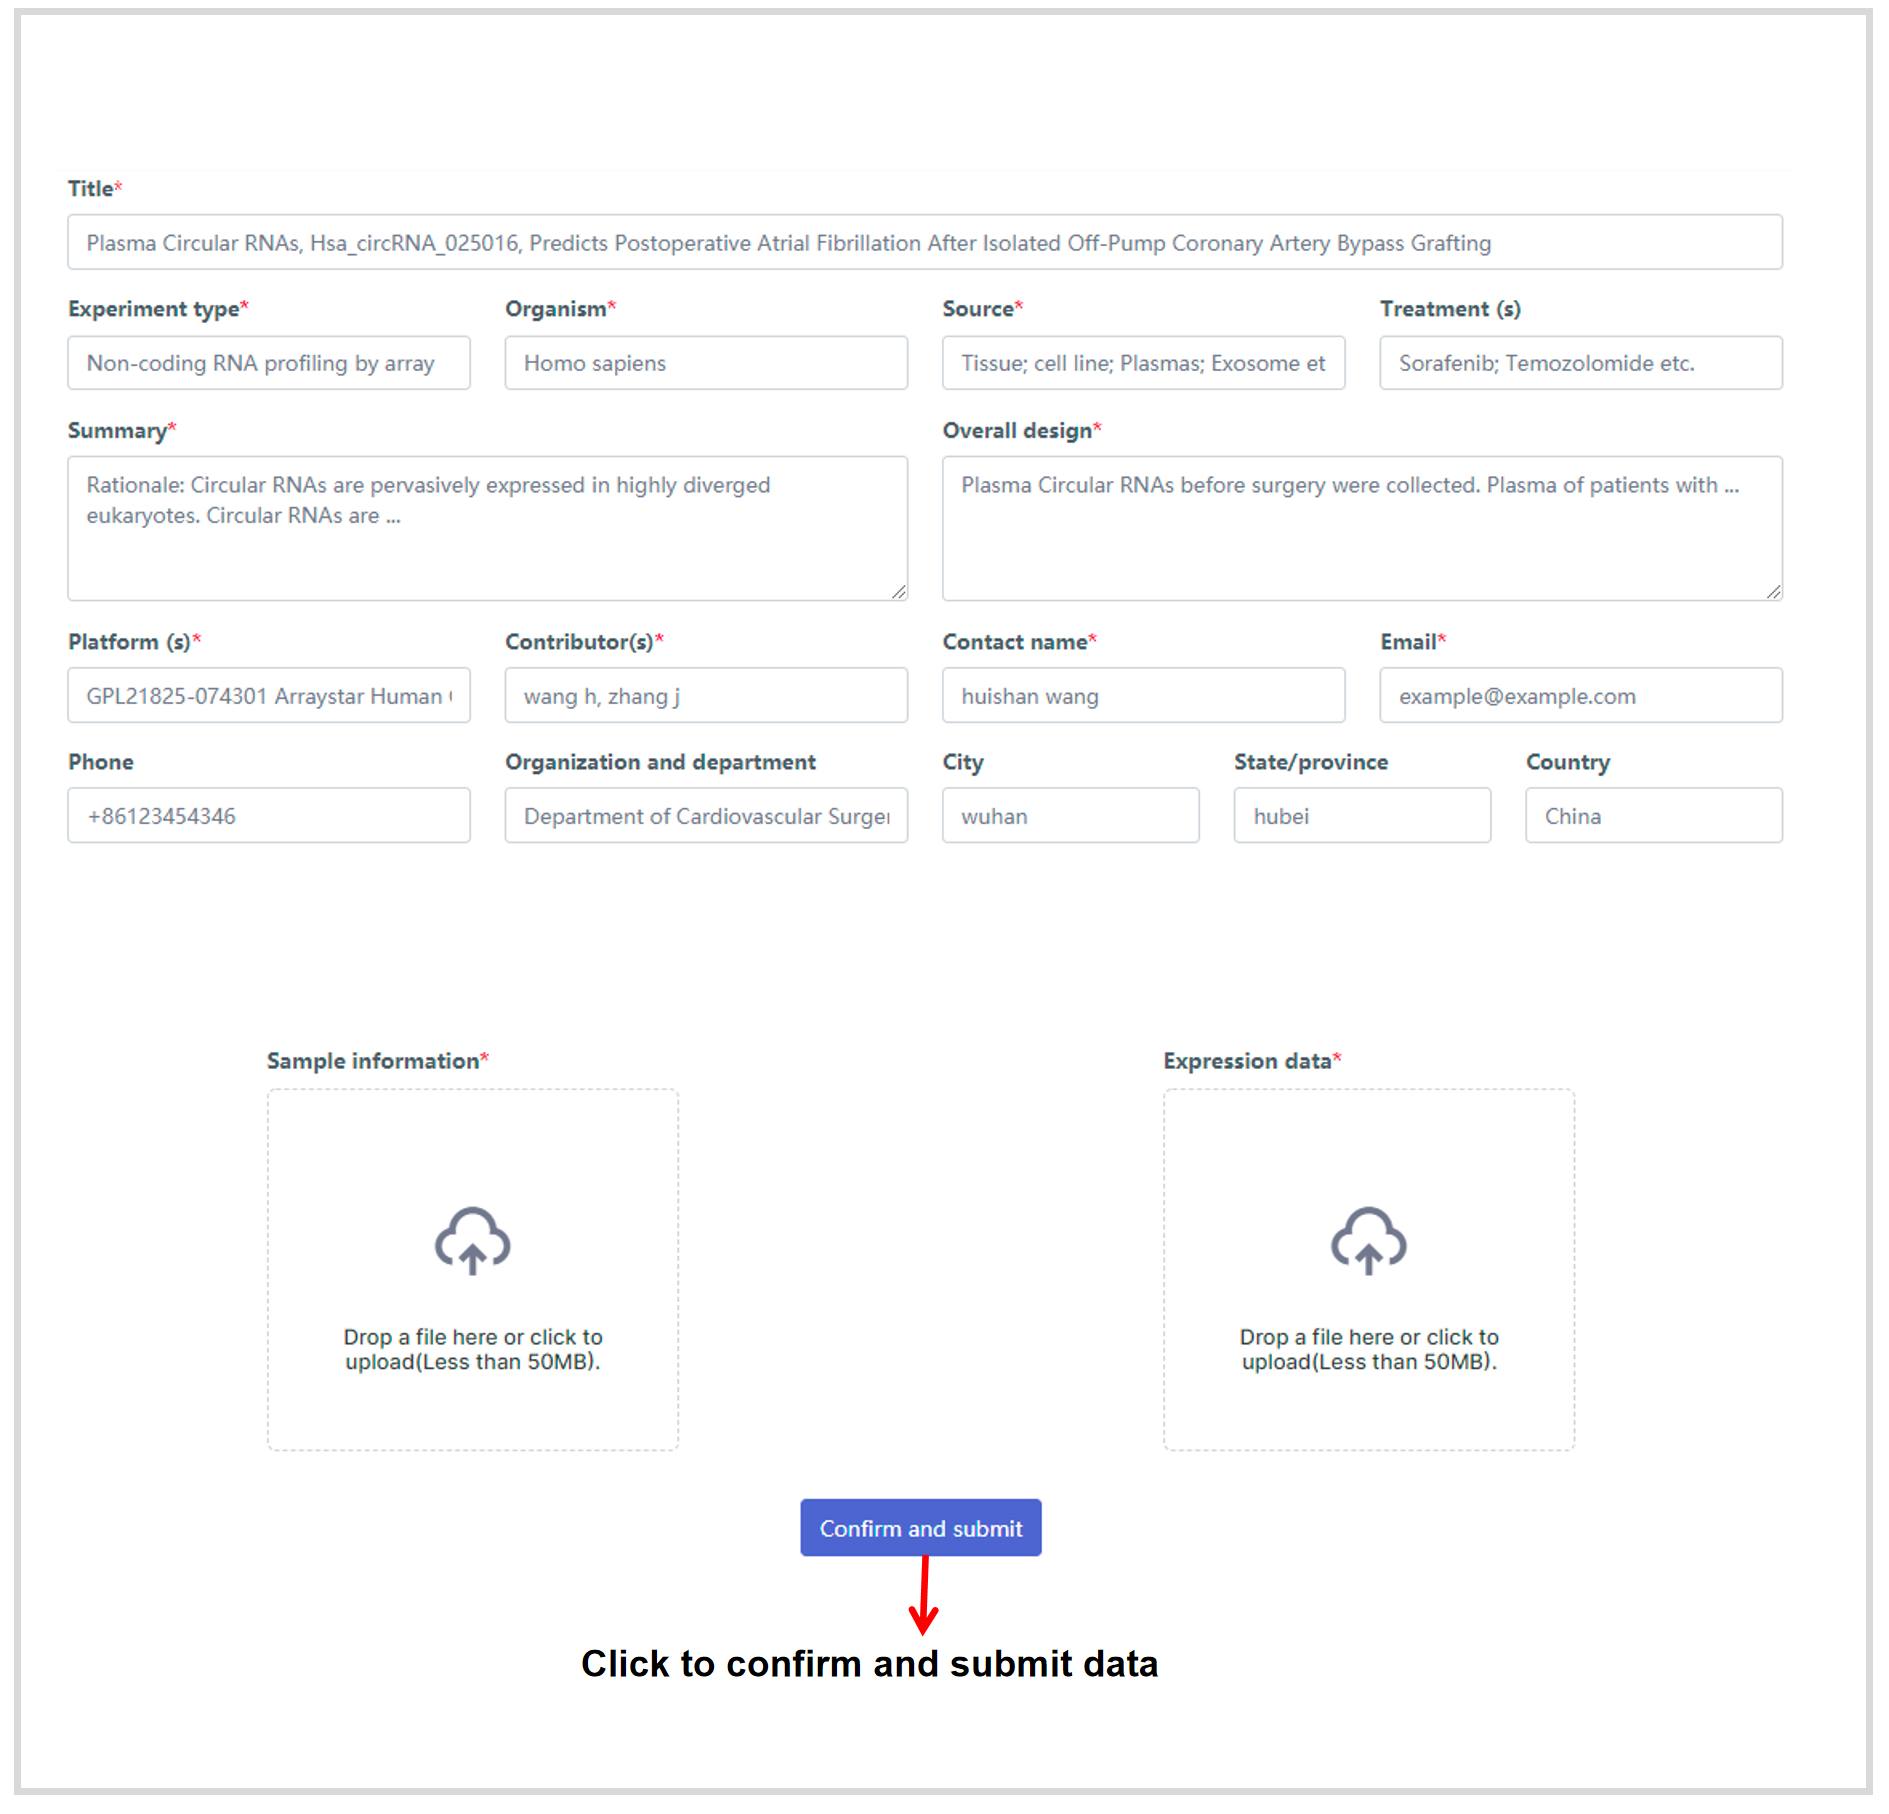
Figure 54. The web interface of the Submit.
20. Download
All data in circMine can be freely downloaded for research purposes.The table allows users to quickly search and browse the interesting data set. Users can click the "Browse circRNAs" button to browse circRNA details in the data set. In addition, we have provided a variety of data set formats for users to choose to download, including TABLE, CSV, and JSON (Figure 55). The normalization method of each data is indicated in the data processing column.
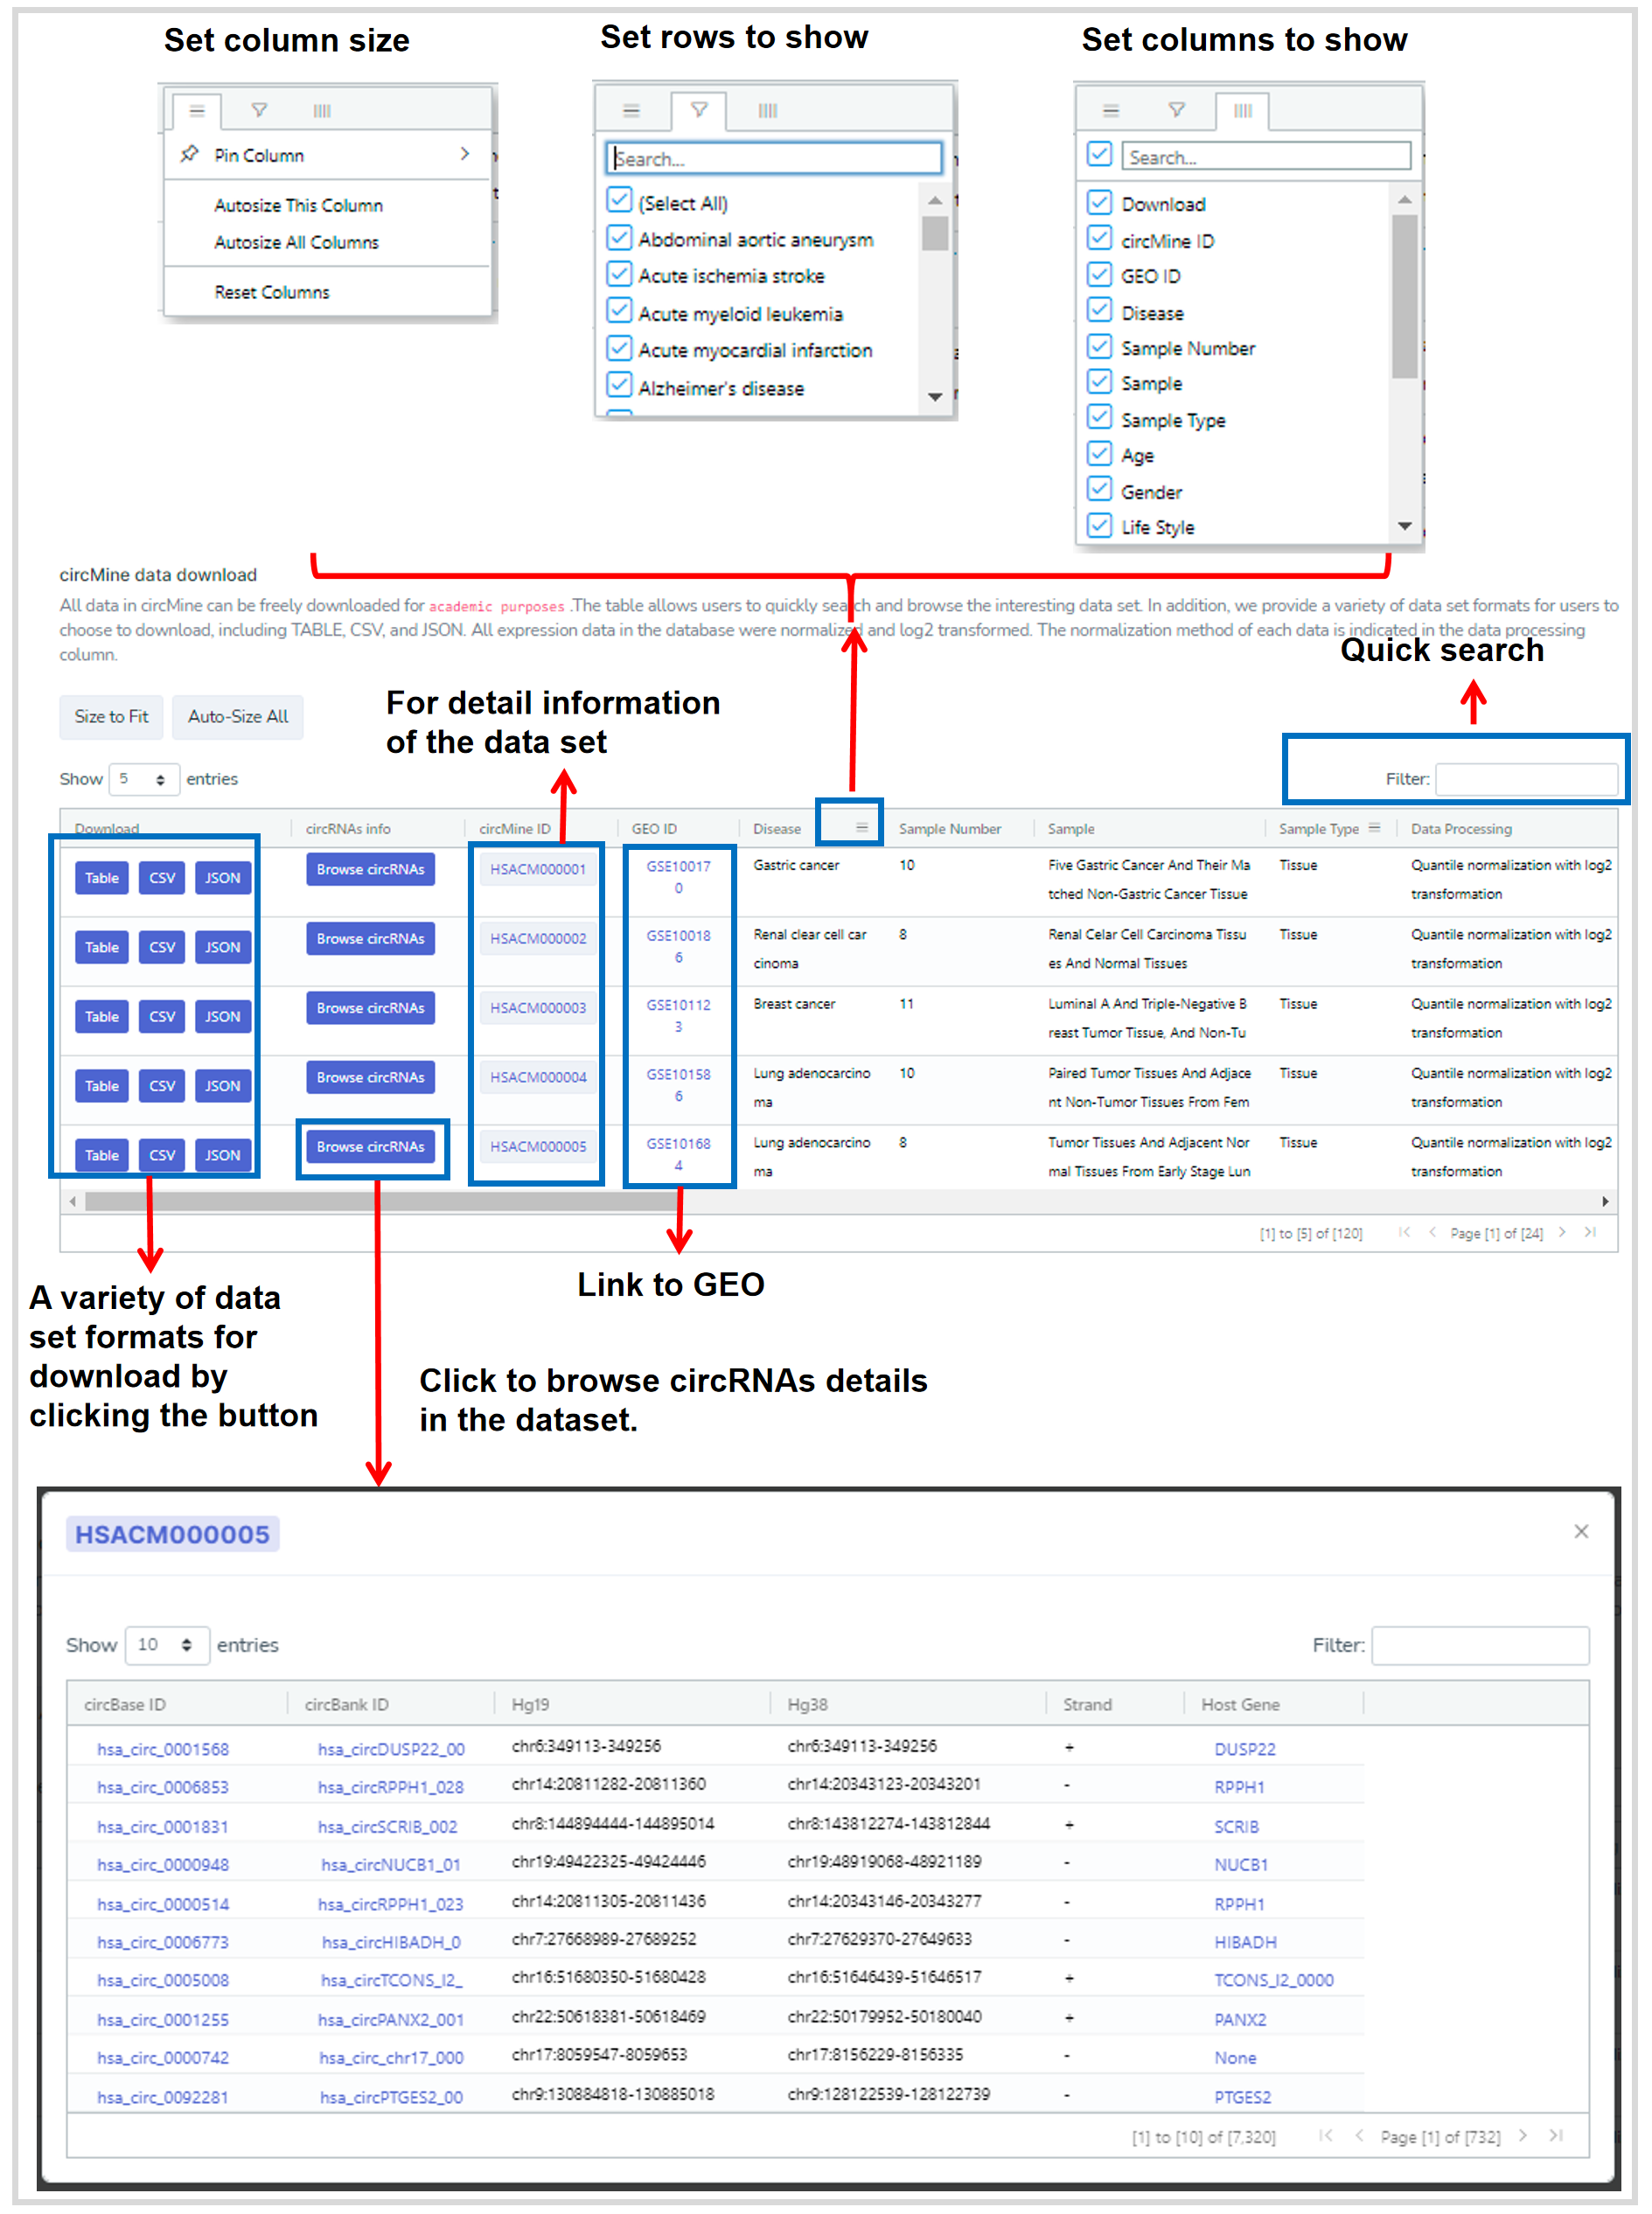
Figure 55. The web interface of the Download.