A detailed tutorial for piRPheno
1. About piRPheno
piRPheno is a manually curated database platform that provides experimentally supported associations between piRNAs and disease phenotypes. piRNAs have been experimentally validated as a novel class of biomarkers and potential drug targets for disease diagnosis, therapy and prognosis. The discovery of relationships between piRNAs and disease phenotypes has become increasingly important. PiRPheno provides experimentally validated associations between piRNAs and disease phenotypes through manual curation on publications. piRPheno provides user-friendly web interfaces and RESTful application programming interfaces for users to browse, search, prioritize, analyze and access data freely.
2. The piRPheno web interfaces
The piRPheno database platform has been tested on Firefox 68.0, Google Chrome 61 and Safari.
2.1 Browse and search:
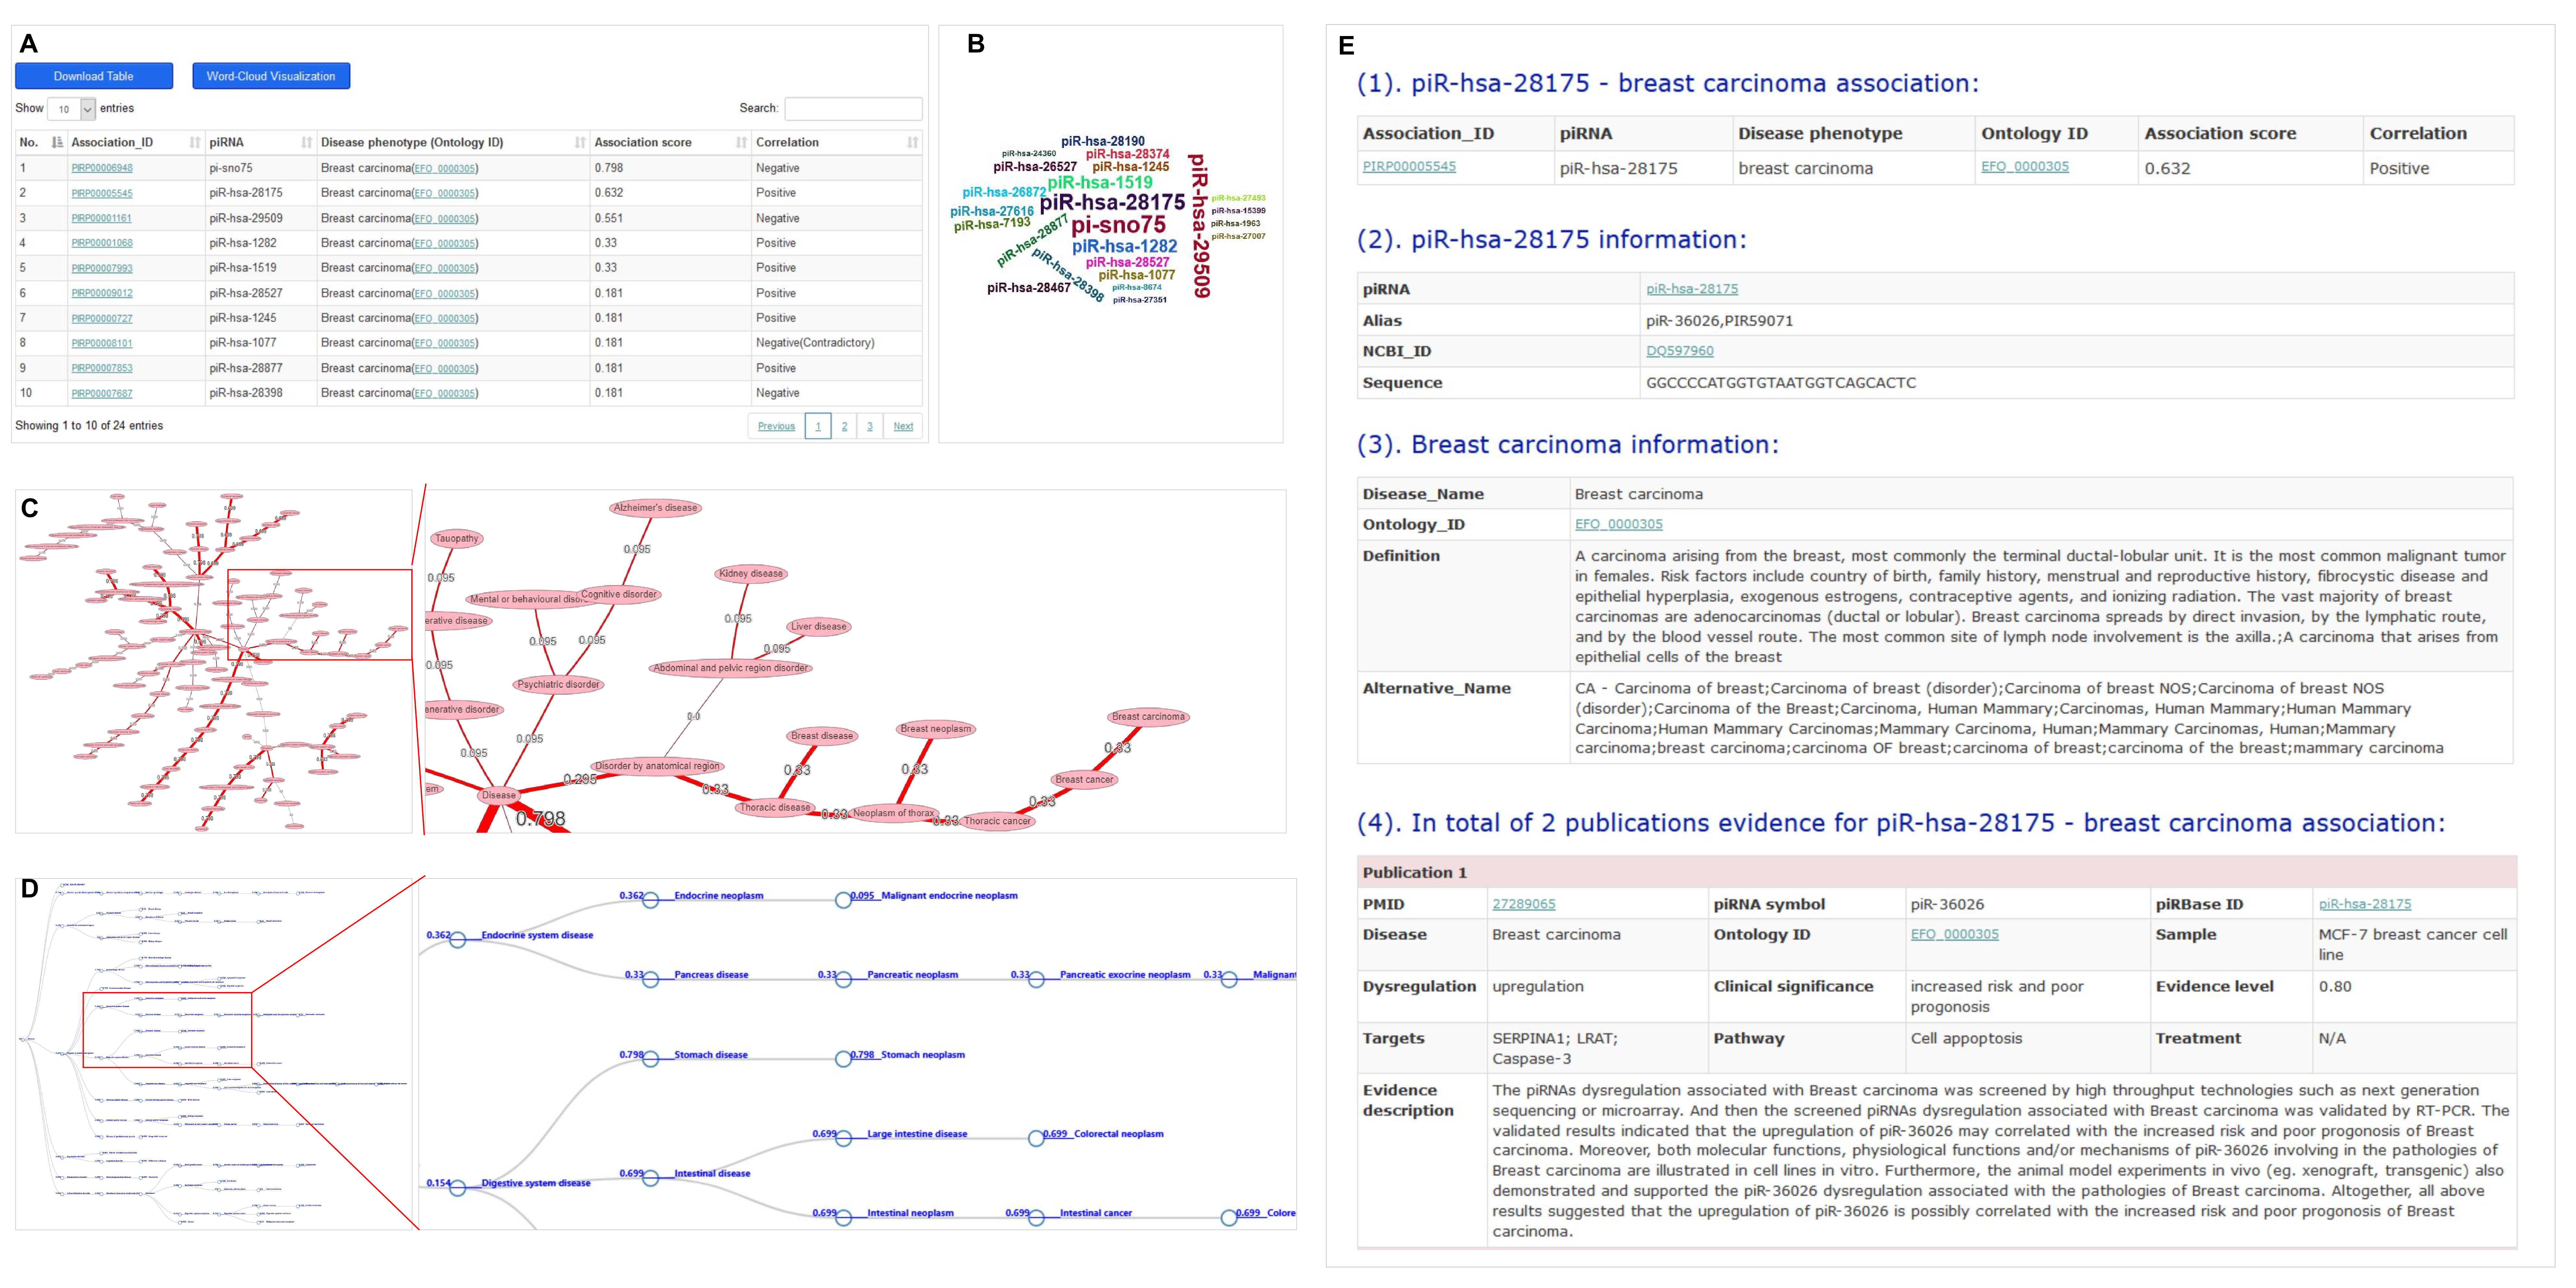
The ‘Browse’ webpage and ‘Search’ webpages in piRPheno allow users to quickly retrieve piRNA-disease associations through searching piRNA and disease phenotype. The resulting association data is displayed in a brief table, showing key information of association identifiers (IDs), piRNA symbols, disease phenotypes with ontology identifier and association scores for prioritization (Figure 1A). The resulting association data of the disease search allows to optionally visualize in a word-cloud diagram (Figure 1B). Similarly, the resulting association data of the piRNA search allows to optionally visualize in a disease-network or -tree diagram (Figure 1C and D). The association IDs in the table (Figure 1A), piRNA symbols in the word-cloud diagram (Figure 1B) and circle nodes in the disease-tree diagram (Figure 1D) link to further information of piRNA, disease phenotype and the supporting evidences in publications (Figure 1E). External links to other reference resources are also provided such as PubMed, piRBase, EFO etc. (Figure 1E).
2.2 piRNAs prioritization application:
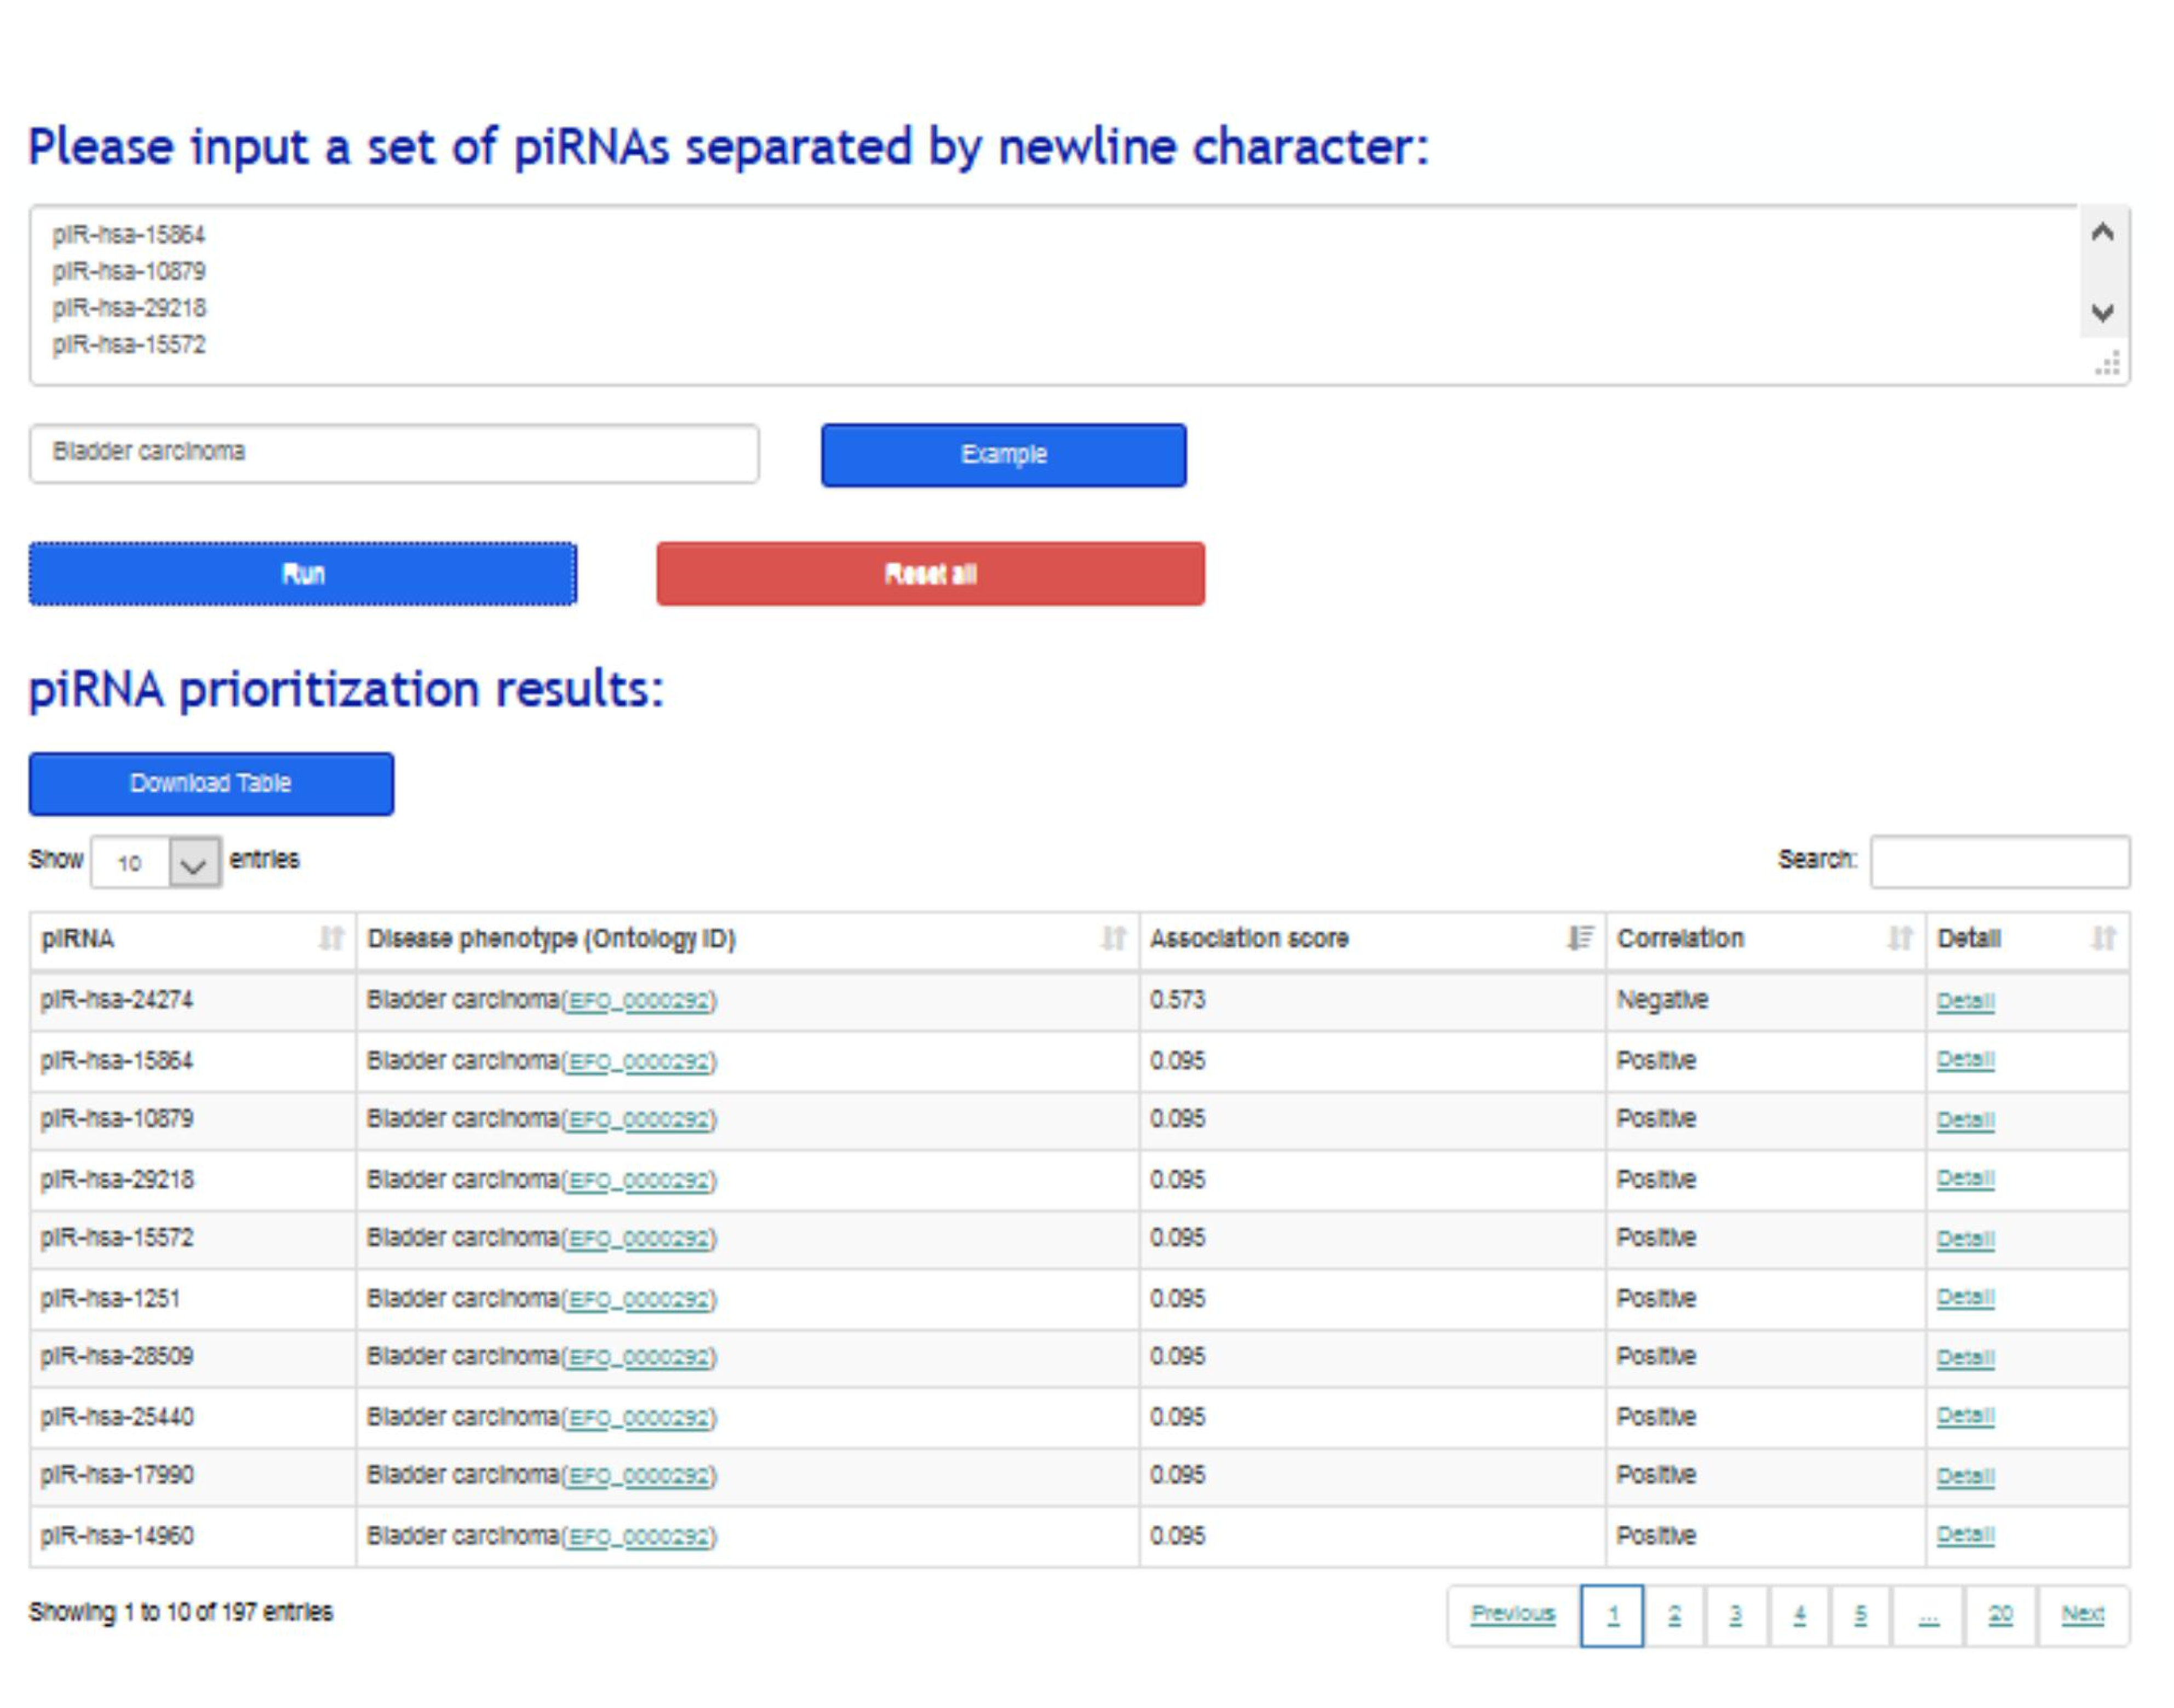
To assist to identify disease-related piRNAs from large-scale piRNAs, a piRNA prioritization application was implemented in piRPheno to prioritize a set of piRNAs to a corresponding disease phenotype. The resulting table allows sorting by association scores and filtering by specific piRNA (Figure 2) , and links to further webpages for detailed information.
2.3 Network visualization application:
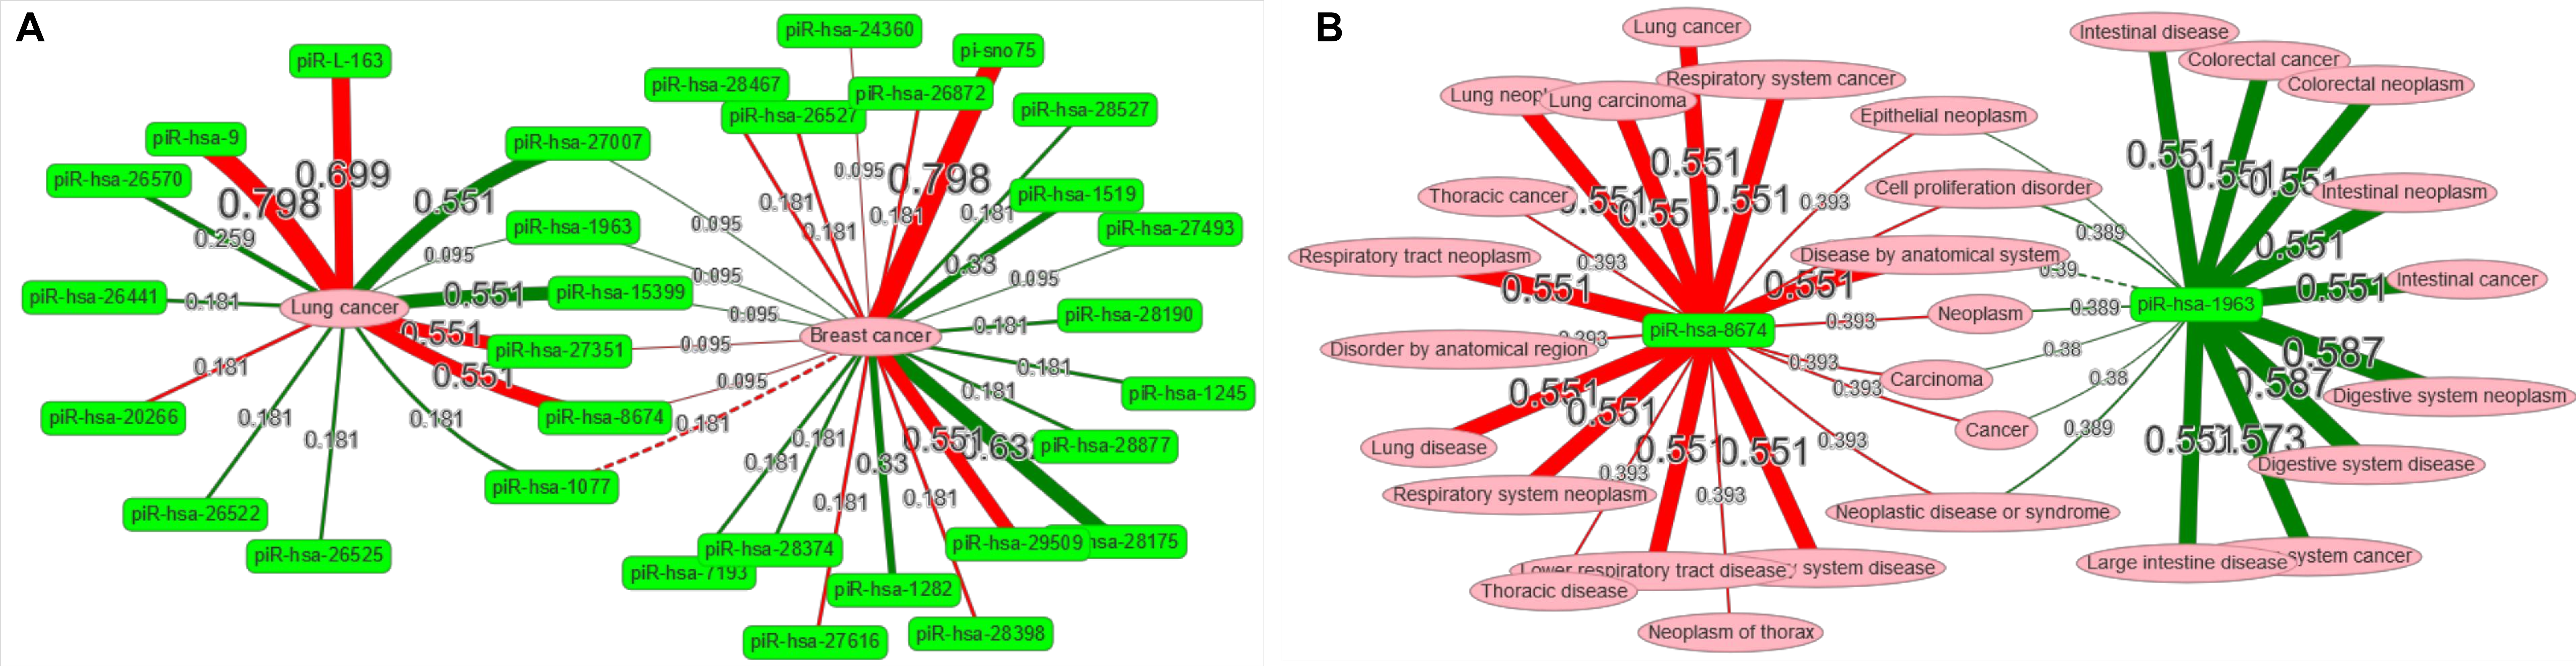
A network visualization application was implemented in piRPheo to explore the relationships between different diseases and piRNAs. The application allows user to enter a set of diseases or piRNAs, and to generate interaction network to display the association data (Figure 3 A and B) .
2.4 Data access and submission:
The website also offers RESTful application programming interfaces (APIs) to access the data programmatically. All resources are accessible through simple RESTful URLs by querying and retrieving an individual entry as well as sets of entries. Output data are available in universal JSON and text formats. Documentation of APIs are available online. All association data in piRPheno can be freely downloaded. In addition, piRPheno encourages users to submit their new association data for future data integration. Once checked by our professional curators and approved by the submission review committee, the submitted records will be included in a future release. Furthermore, a detailed tutorial is available on the ‘Help’ webpage.
3. Computation of association score
Experimental evidences in publications such as experiment methods, number of publications and diseases parent-child relationships have been included to support the associations. An association scoring model has been established based on these evidential metrics and integrated in piRPheno to prioritize and interpret the piRNA dysregulation-disease associations. The association scoring model consists of four steps to compute the association scores.
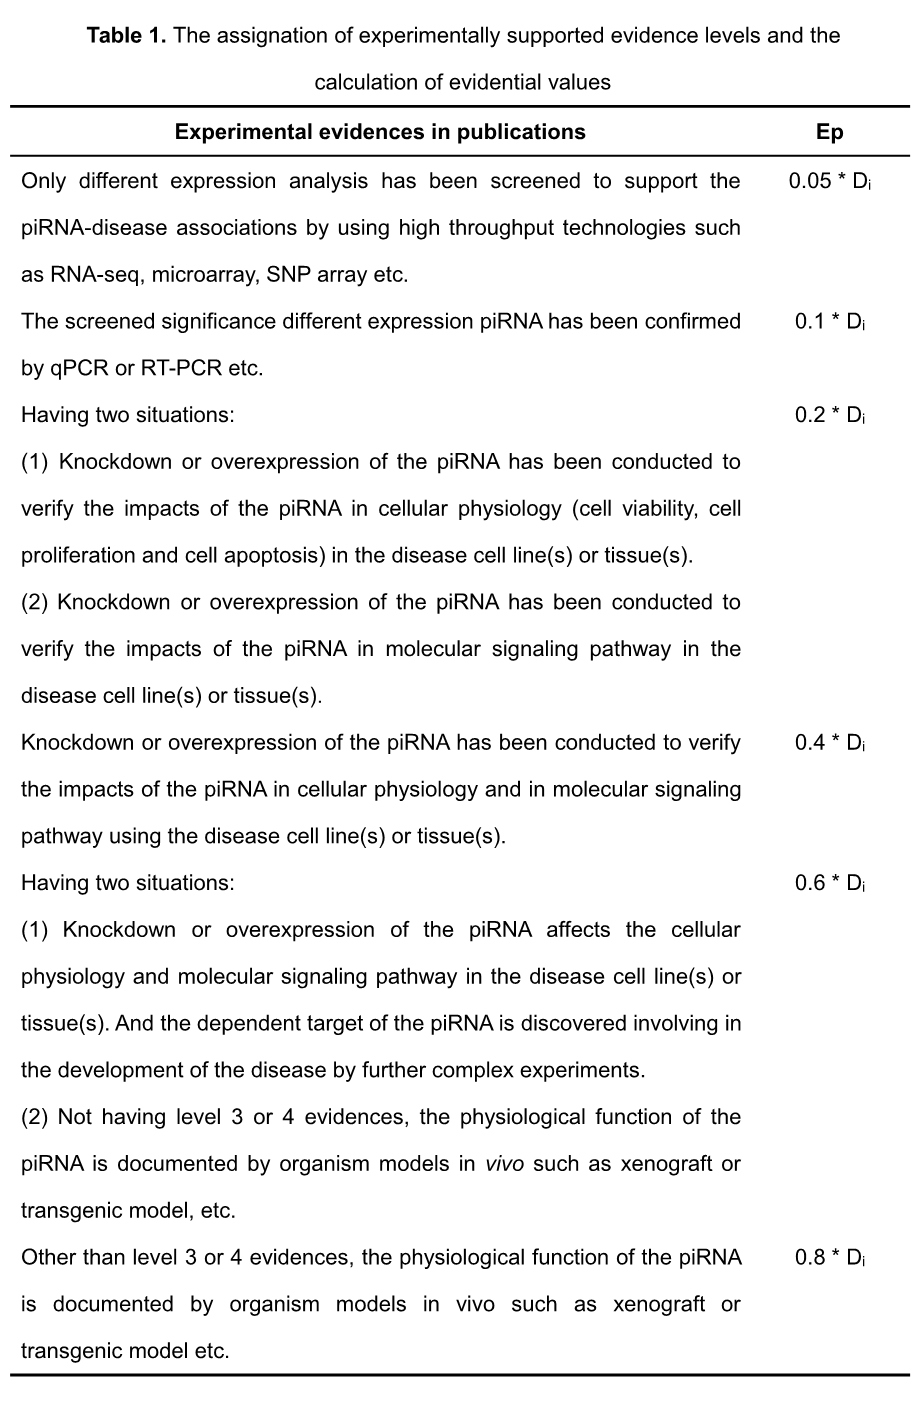
Step 1: In principle, validation experiments of mechanism and functional analyses provide more reliable evidence than throughput expression analyses. Based on the validation experiments in publications, we defined and assigned the experimentally supported evidence levels into six levels, as detailed in Table 1. The evidential value in publication (Ep) for supporting piRNA-disease association is empirically defined and calculated, as indicated in Table 1. Di (Di ∈ {-1,1}) in Table 1 represents the changing direction of a piRNA associated with a disease. If a piRNA is increased (or obtain function) in a disease, Di equates to 1; if a piRNA is decreased (or loss function) in a disease, Di equates to -1.
Step 2: A large number of publications can enhance the evidential values (Score) for supporting the same piRNA-disease association. To dampen the effect of large number of publications, a harmonic sum function (Hagen, 2008; Koscielny et al., 2017) was used to account Score and abs_Score. The Score and abs_Score are respectively calculating as following equation:

As indicated in equation (1) and (2) , “n” is the total number of supporting publications, and Ep1, Ep2, Ep3, …, Epn are the sorted evidential values of different supporting publications in descending order. The Score of an association less than zero indicates that the piRNA dysfunction is negatively associated with the development of disease, and thus the clinical correlation of the association was assigned as “Negative”. On the contrary, the Score of an association greater than zero indicates that the piRNA dysfunction is positively associated with the development of disease, and thus the clinical correlation of the association was assigned with “Positive”. In addition, if the absolute of Score (|Score|) of an association is less than the abs_Score of the association, the clinical correlation of the association was assigned with “Contradictory”. The assignation of “Contradictory” means that the association have conflicting evidence supported.
Step 3: The Score above was normalized to limit the range of confidence score from 0 to 1.0.
In equation [3], ‘e’ represents the natural constant e.
4. Data attribute
The following information can help you to interpret piRNA-disease associations.
piRNA
To make the piRNA symbols more consistent with other databases, piRPheno provides both the identifiers and links for the piRNAs in the piRBase and the NCBI databases.
Disease phenotype
To make the disease phenotypes more consistent with other databases, piRPheno provides both the identifiers and links for the disease phenotypes in the EMBL-EBI Experimental Factor Ontology resource.
5. Contact us
If you have any inquiries, please do not hesitate to contact us via email: zhangwl2@hku-szh.org

Bioinformatics Laboratory for Precision Medicine 粤ICP备2020092302号-1; 粤ICP备2020092302号-2
